


Nasdaq 100 Opens Lower Following Big Tech Earnings
FXOpen

Last week saw the release of quarterly earnings from Microsoft (MSFT), Meta Platforms (META), Tesla (TSLA) and Apple (AAPL). At the opening of Monday’s session — today, 2 February — the Nasdaq 100 index (US Tech 100 mini on FXOpen) opened with a bearish gap, sliding towards the 25,100 level.
Why Is the Nasdaq 100 Falling?
While many of the Big Tech earnings reports were strong, the broader market reaction suggests that:
→ investors have become increasingly sceptical about massive capital expenditure (capex) on artificial intelligence, as seen in Microsoft’s case;
→ even solid results, such as those delivered by Apple, are no longer triggering rallies.
It appears that market participants are placing greater emphasis on uncertainties related to:
→ the new Fed Chair;
→ the risk of another US government shutdown;
→ rising geopolitical tensions (with Greenland, Iran and Ukraine potentially joined by Cuba).
Technical Analysis of the Nasdaq 100 Chart
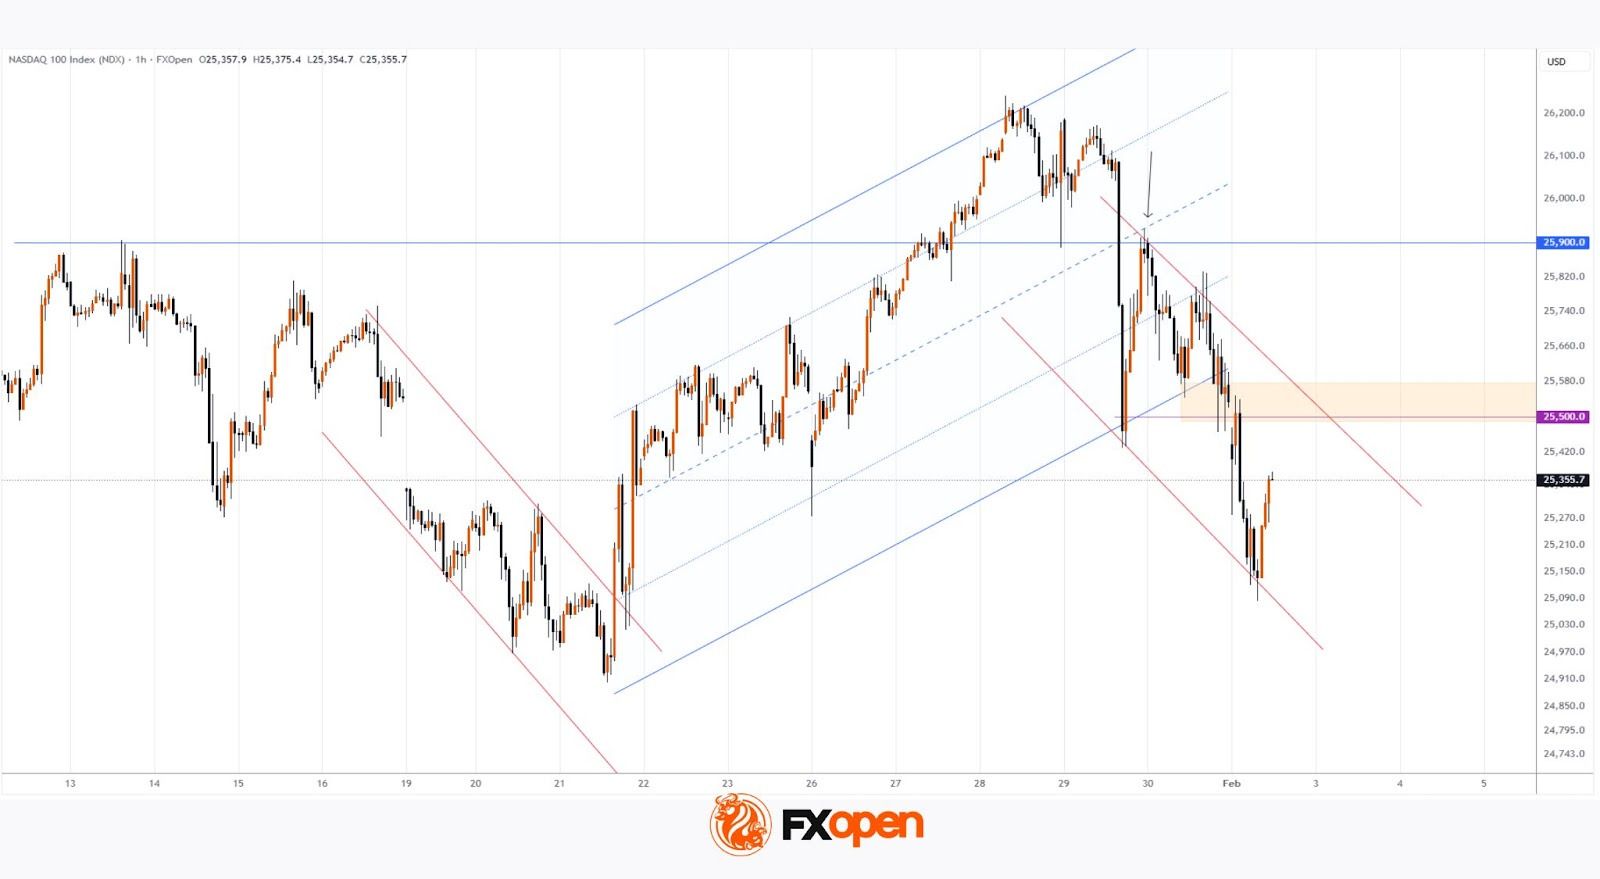
When analysing Nasdaq 100 price action (US Tech 100 mini on FXOpen) six days ago, we:
→ identified an ascending channel (shown in blue);
→ considered a scenario involving another false bullish breakout following the move above the 13 January high;
→ anticipated a modest technical correction.
Since then:
→ the price has marginally extended the channel, while its slope has remained unchanged;
→ the index declined from the upper boundary to the lower boundary of the channel, with the median acting as resistance (as indicated by the arrow);
→ this was followed by a bearish break below the lower boundary.
As a result, Nasdaq 100 price action can now reasonably be viewed as a corrective phase, with the potential to evolve into a downward trajectory (shown by the red lines).
If bears are to maintain control, it would be logical for them to assert dominance over the area around 25,500 — the zone where the ascending channel was broken.
Trade global index CFDs with zero commission and tight spreads (additional fees may apply). Open your FXOpen account now or learn more about trading index CFDs with FXOpen.
This article represents the opinion of the Companies operating under the FXOpen brand only. It is not to be construed as an offer, solicitation, or recommendation with respect to products and services provided by the Companies operating under the FXOpen brand, nor is it to be considered financial advice.
Stay ahead of the market!
Subscribe now to our mailing list and receive the latest market news and insights delivered directly to your inbox.


Latest articles

EUR/USD: All Eyes on the Fed as the Range Reaches Its Breaking Point
The dollar's next move hinges on tonight's Fed decision, and this time markets genuinely don't know what to expect. While economists still lean toward a hold—with CME FedWatch odds sitting near 68.5% for no change—Kevin Warsh's hawkish

USD/JPY and USD/CAD Test Resistance Ahead of Fresh Fed Signals
The US dollar continues to hold the upper hand against most major currencies ahead of the outcome of the latest Federal Reserve meeting. While the base-case scenario remains for interest rates to stay unchanged, markets are also pricing in the

Amazon Earnings: Does the Chart Already Know Something the Numbers Don't?
All eyes are on July 30, when Amazon reports Q2 2026 earnings, with Wall Street increasingly convinced the bar has been set too low. Consensus sees EPS near $1.82-$2.26 on roughly $197 billion in revenue, but the