


AUD/USD and NZD/USD Target Additional Gains
FXOpen

AUD/USD started a fresh increase above the 0.7320 resistance zone. NZD/USD also climbed higher and it might continue to rise towards the 0.7120 level.
Important Takeaways for AUD/USD and NZD/USD
· The Aussie Dollar started a steady increase above the 0.7320 hurdle against the US Dollar.
· There was a break above a key declining channel with resistance near 0.7350 on the hourly chart of AUD/USD.
· NZD/USD also gained pace after it broke the 0.6970 resistance.
· There is a key rising channel forming with support near 0.7040 on the hourly chart of NZD/USD.
AUD/USD Technical Analysis
The Aussie Dollar found formed a base above the 0.7280 level and started a fresh increase against the US Dollar. The AUD/USD pair broke the 0.7300 and 0.7320 resistance levels to move into a positive zone.
The pair even broke the 0.7350 and 0.7380 resistance levels. There was a break above a key declining channel with resistance near 0.7350 on the hourly chart of AUD/USD. The pair even cleared the 0.7400 level and the 50 hourly simple moving average.
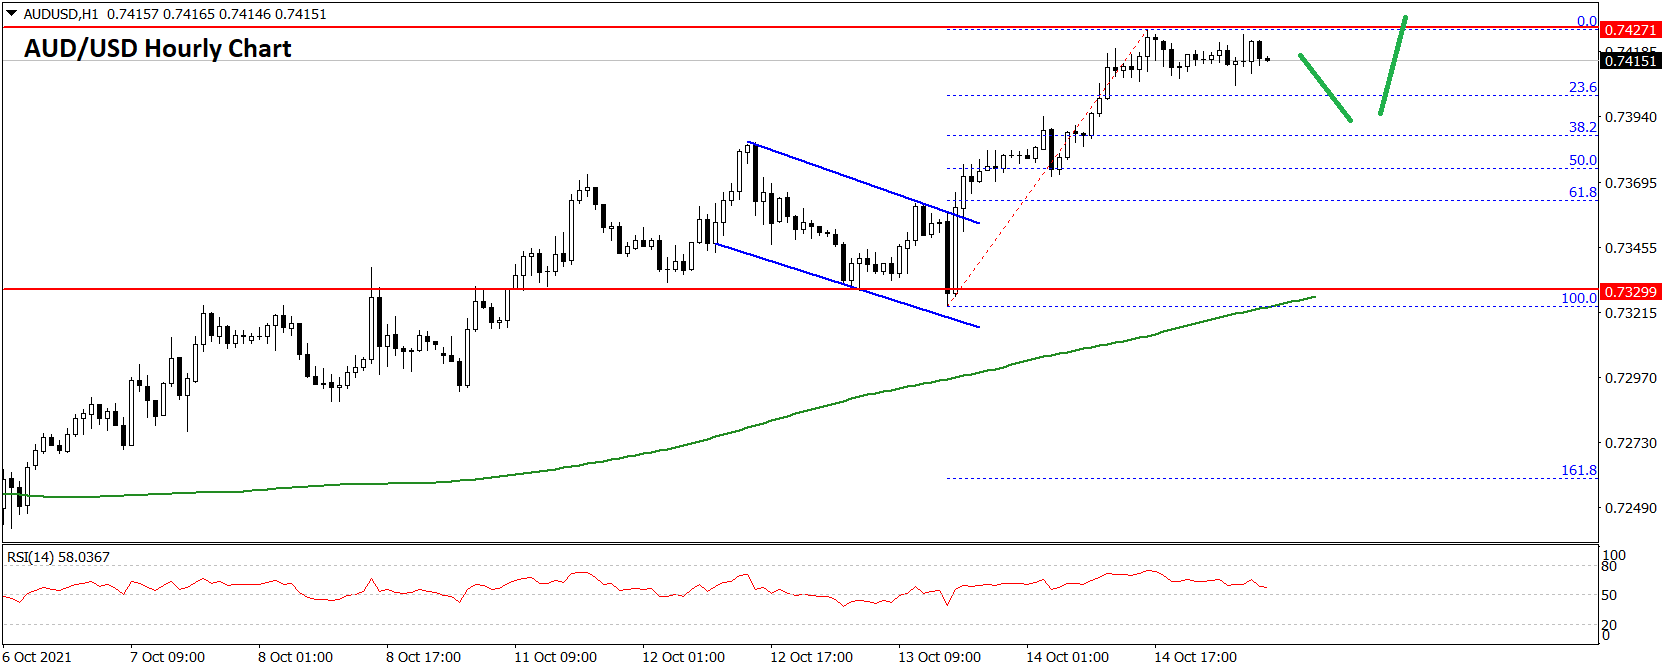
A high was formed near 0.7424 on FXOpen and the pair is now consolidating gains. It is trading above the 23.6% Fib retracement level of the recent wave from the 0.7323 swing low to 0.7424 high.
An initial support on the downside is near the 0.7400 level. The next major support is near the 0.7370 level. It is close to the 50% Fib retracement level of the recent wave from the 0.7323 swing low to 0.7424 high.
If there is a downside break below the 0.7370 support, the pair could extend its decline towards the 0.7330 level and the 50 hourly simple moving average.
An immediate resistance is near the 0.7425 level. The next major resistance is near the 0.7440 level. A close above the 0.7440 level could start a steady increase in the near term. The next major resistance could be 0.7500.
NZD/USD Technical Analysis
The New Zealand Dollar also followed a similar path from the 0.6900 zone against the US Dollar. The NZD/USD pair formed a base near 0.6920 and started a fresh increase.
The pair broke the 0.6950 and 0.7000 resistance levels. It even cleared the 0.7040 level and the 50 hourly simple moving average. A high was formed near 0.7052 and the pair is now consolidating gains.
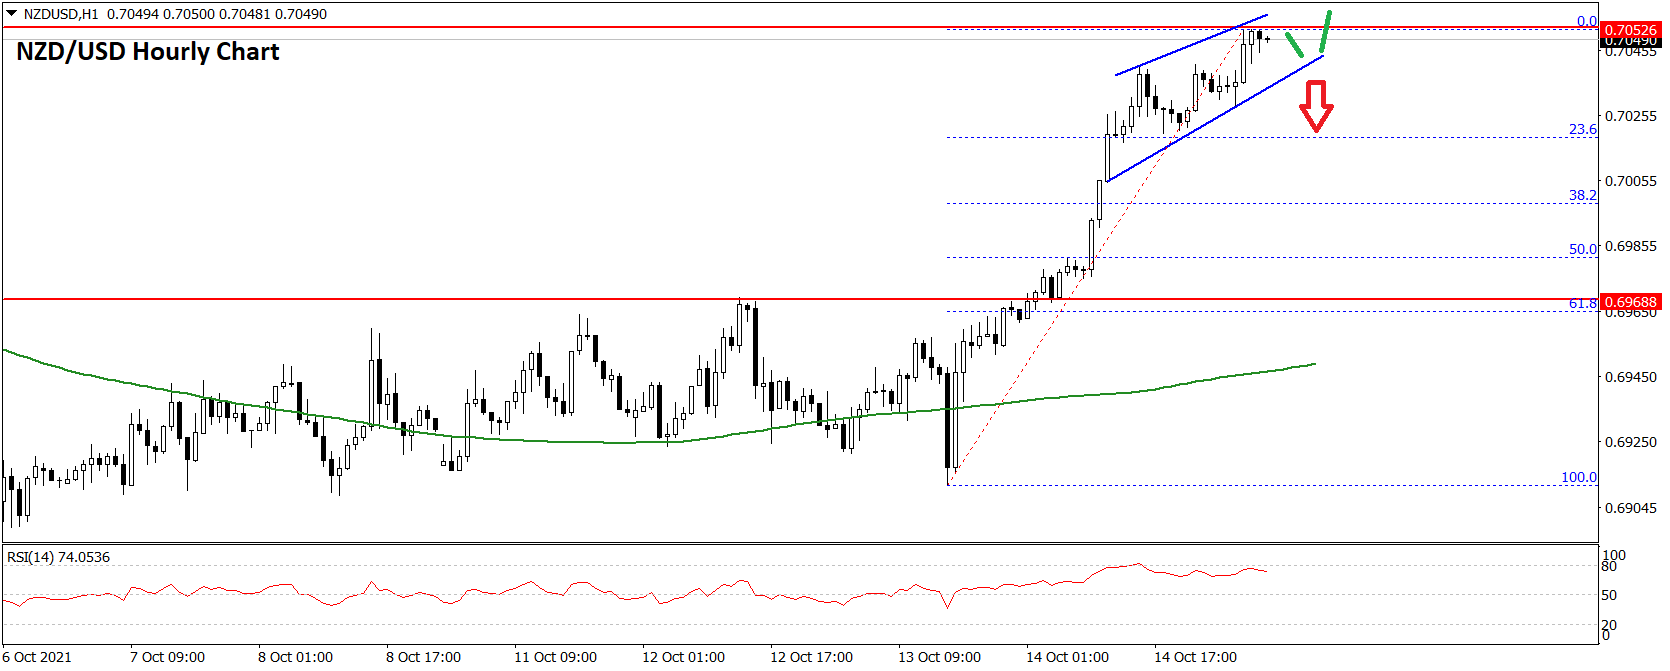
An immediate support is near the 0.7040 level. There is also a key rising channel forming with support near 0.7040 on the hourly chart of NZD/USD. The next major support is near 0.7020. It is near the 23.6% Fib retracement level of the recent increase from the 0.6911 swing low to 0.7052 high.
If there is a downside break below the 0.7020 support, the pair could extend its decline towards the 0.7000 level. The next key support may be the 50% Fib retracement level of the recent increase from the 0.6911 swing low to 0.7052 high.
On the upside, the bulls are facing hurdles near 0.7055. The next major resistance is near the 0.7080 level. A close above the 0.7080 level could start a steady increase in the near term. The next major stop for the bulls could be 0.7120.
This forecast represents FXOpen Markets Limited opinion only, it should not be construed as an offer, invitation or recommendation in respect to FXOpen Markets Limited products and services or as financial advice.
This article represents the opinion of the Companies operating under the FXOpen brand only. It is not to be construed as an offer, solicitation, or recommendation with respect to products and services provided by the Companies operating under the FXOpen brand, nor is it to be considered financial advice.
Stay ahead of the market!
Subscribe now to our mailing list and receive the latest market news and insights delivered directly to your inbox.

Latest articles

AUD/USD: Will the RBA Be Able to Keep Its Currency Strong?
As the chart shows, AUD/USD has entered a distinctly bearish phase in recent weeks, reflecting the broader consolidation — and in some cases outright weakness — that the US dollar has begun imposing across most major currency pairs.
Fundamental Analysis
The

AUD/CAD: Pair Remains Range-Bound Amid Interest Rate Divergence
The key macroeconomic factor for AUD/CAD remains the divergence in monetary policy between the two central banks. After three consecutive rate hikes since the beginning of the year, the Reserve Bank of Australia left its cash rate unchanged at

Brent Crude Oil Analysis: Stabilisation or Simply a Pause?
Over the past few weeks, financial markets have been more focused than ever on developments surrounding the Strait of Hormuz — a critical waterway at the centre of ongoing US-Iran negotiations. The back-and-forth of diplomatic headlines has injected significant volatility into