


AUD/USD and NZD/USD Target More Upsides
FXOpen

AUD/USD started a fresh increase from the 0.6965 zone. NZD/USD is also rising and there was a clear move above the 0.6650 resistance.
Important Takeaways for AUD/USD and NZD/USD
· The Aussie Dollar started a fresh increase after it cleared 0.7000 against the US Dollar.
· There was a break above a couple of bullish patterns near 0.7070 and 0.7130 on the hourly chart of AUD/USD.
· NZD/USD also climbed higher after forming a base above the 0.6540 level.
· There is a major bullish trend line forming with support near 0.6650 on the hourly chart of NZD/USD.
AUD/USD Technical Analysis
The Aussie Dollar found support near the 0.6965 zone against the US Dollar. The AUD/USD pair traded as low as 0.6967 on FXOpen before it started a fresh increase.
There was a clear move above the 0.7000 and 0.7020 resistance levels. Besides, there was a break above a couple of bullish patterns near 0.7070 and 0.7130 on the hourly chart of AUD/USD. The pair surged above the 0.7150 level and the 50 hourly simple moving average.
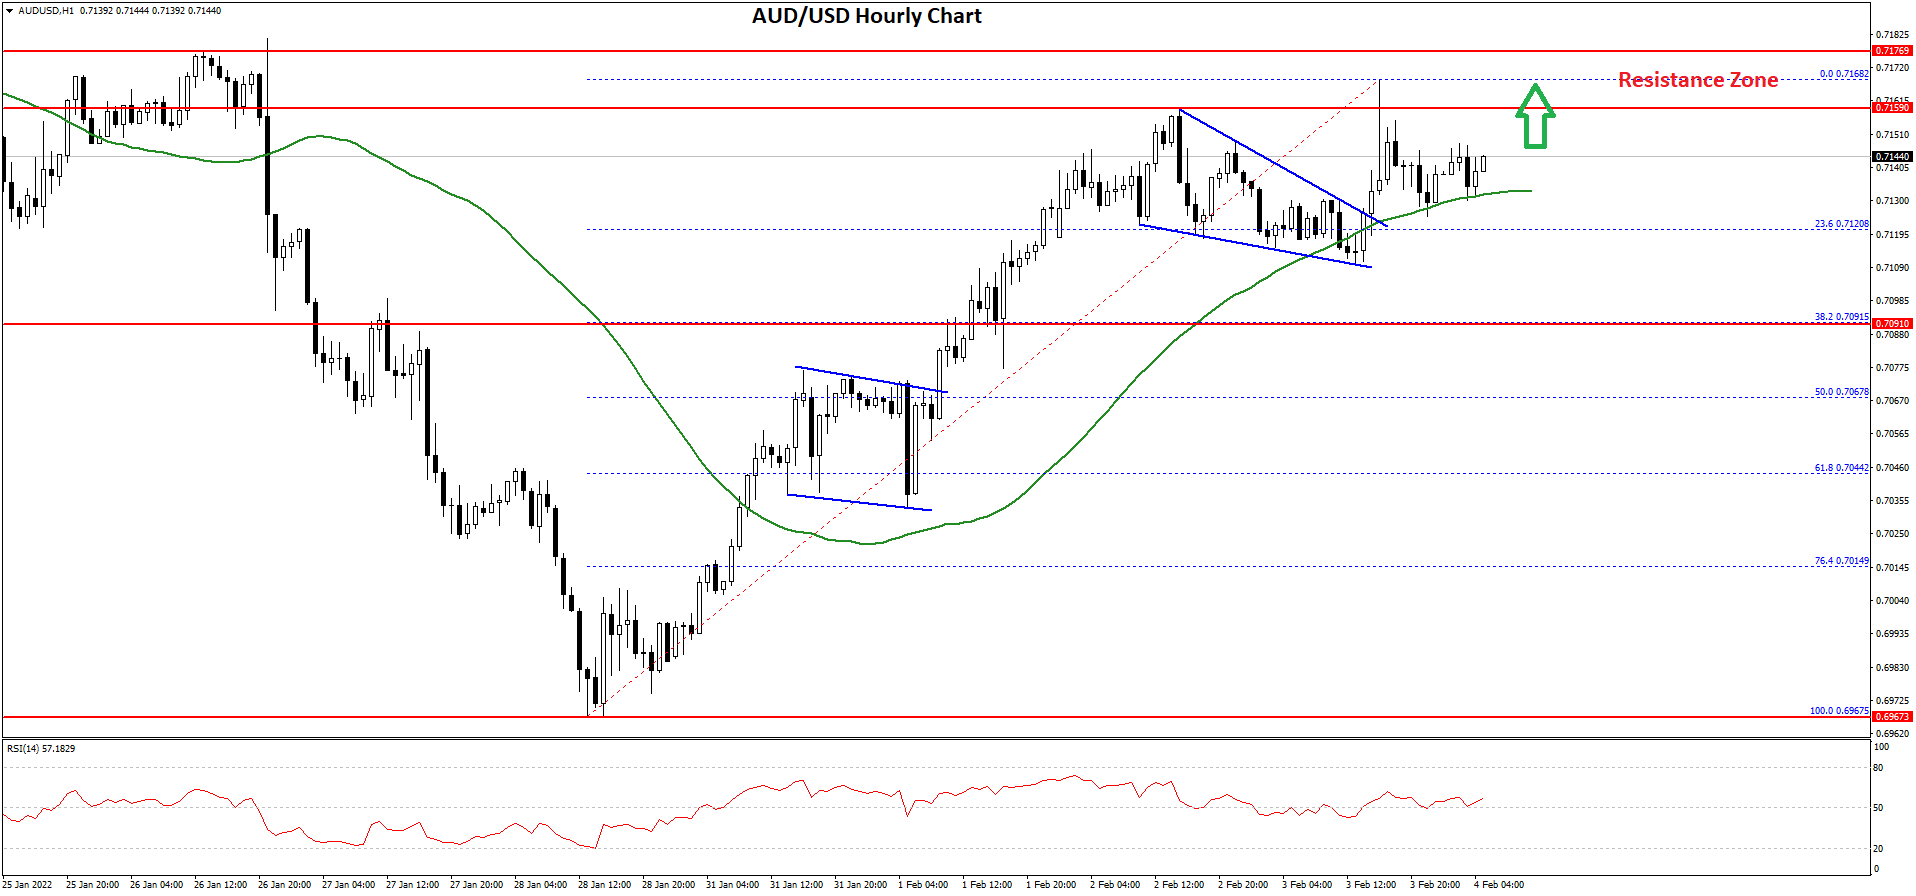
It traded as high as 0.7168 and currently consolidating gains. On the downside, an initial support is near the 0.7130 level and the 50 hourly simple moving average.
The next support is near the 23.6% Fib retracement level of the upward move from the 0.6967 swing low to 0.7168 high. If there is a downside break below the 0.7120 support, the pair could extend its decline towards the 0.7070 level.
The 50% Fib retracement level of the upward move from the 0.6967 swing low to 0.7168 high is near the 0.7070 level to provide support. Any more downsides might send the pair toward the 0.7000 level.
On the upside, the pair is facing resistance near the 0.7170 level. The next major resistance is near the 0.7200 level. A close above the 0.7200 level could start a steady increase in the near term. The next major resistance could be 0.7320.
NZD/USD Technical Analysis
The New Zealand Dollar also followed a similar path from the 0.6530 zone against the US Dollar. The NZD/USD pair gained pace above the 0.6580 resistance zone to move into a positive zone.
The pair even traded above the 0.6600 level and the 50 hourly simple moving average. There was a clear move above the 50% Fib retracement level of the downward move from the 0.6701 swing high to 0.6529 low.
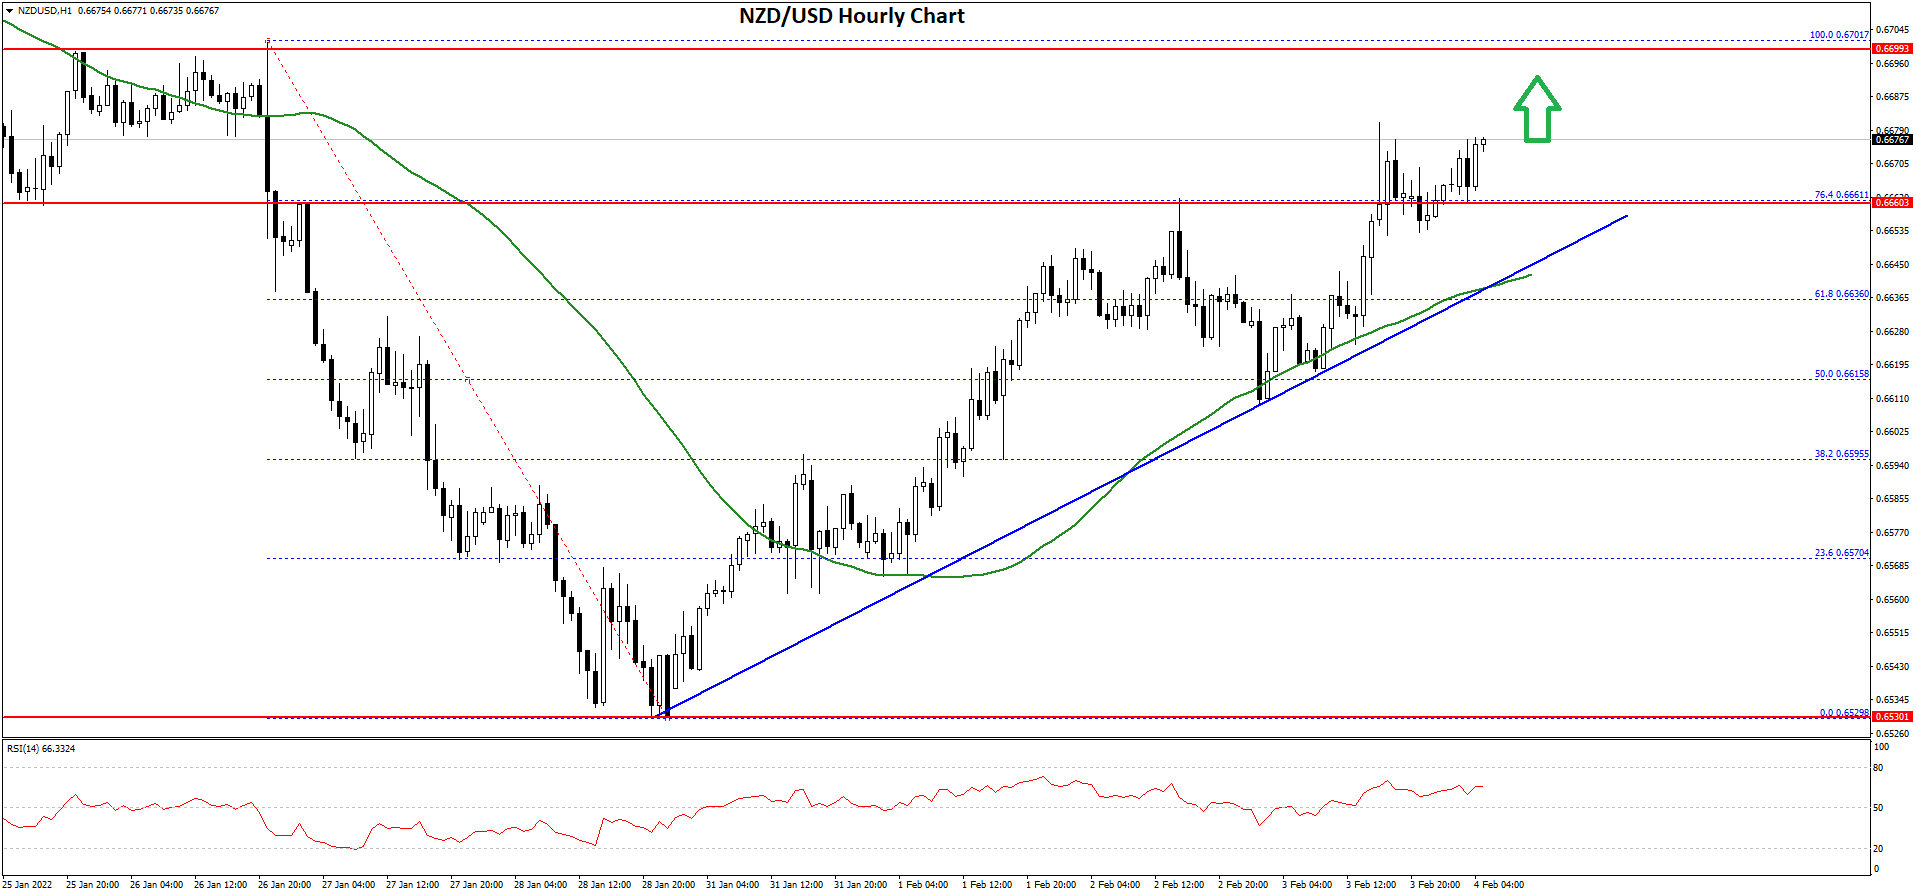
It is now trading above the 0.6660 level and the 76.4% Fib retracement level of the downward move from the 0.6701 swing high to 0.6529 low.
An immediate resistance is near the 0.6685 level. The first key resistance is near the 0.6700 level. The next major resistance is near the 0.6720 level. A clear move above the 0.6720 level might even push the pair above the 0.6800 level.
On the downside, an initial support is near the 0.6650 level. There is also a major bullish trend line forming with support near 0.6650 on the hourly chart of NZD/USD.
The first key support is near the 0.6645 level and the 50 hourly SMA, below which the pair could extend losses. The next major support is near the 0.6600 level.
This forecast represents FXOpen Markets Limited opinion only, it should not be construed as an offer, invitation or recommendation in respect to FXOpen Markets Limited products and services or as financial advice.
Trade over 50 forex markets 24 hours a day with FXOpen. Take advantage of low commissions, deep liquidity, and spreads from 0.0 pips (additional fees may apply). Open your FXOpen account now or learn more about trading forex with FXOpen.
This article represents the opinion of the Companies operating under the FXOpen brand only. It is not to be construed as an offer, solicitation, or recommendation with respect to products and services provided by the Companies operating under the FXOpen brand, nor is it to be considered financial advice.
Stay ahead of the market!
Subscribe now to our mailing list and receive the latest market news and insights delivered directly to your inbox.


Latest articles

Amazon Earnings: Does the Chart Already Know Something the Numbers Don't?
All eyes are on July 30, when Amazon reports Q2 2026 earnings, with Wall Street increasingly convinced the bar has been set too low. Consensus sees EPS near $1.82-$2.26 on roughly $197 billion in revenue, but the

WTI Analysis: Gap Breaks Short-Term Trend as Price Remains Trapped Between the POC and Profile Boundary
WTI crude oil plunged by more than 7% on 27 July 2026 after the US suspended a series of strikes against Iran over the weekend, raising hopes of a diplomatic solution and the reopening of shipping through the Strait of

US Dollar Index: A Defining Week for the King of the Markets
The dollar heads into a pivotal week trading near 101.80, just off a 15-month high, with the Fed's July 29 meeting standing as the clear focal point. Markets currently price roughly a 65% chance of a hold, though renewed