


AUD/USD and NZD/USD Turn Red, Risk of More Losses
FXOpen

AUD/USD gained bearish momentum below the 0.7550 support zone. NZD/USD started a major decline after it faced sellers near 0.7030.
Important Takeaways for AUD/USD and NZD/USD
· The Aussie Dollar started a fresh decline after it struggled near 0.7660 against the US Dollar.
· There was a break below a key bullish trend line with support near 0.7530 on the hourly chart of AUD/USD.
· NZD/USD also started a major decline after it failed to stay above 0.7000.
· There was a move below a key bullish trend line with support near 0.6950 on the hourly chart of NZD/USD.
AUD/USD Technical Analysis
The Aussie Dollar faced a strong selling interest near the 0.7660 level against the US Dollar. The AUD/USD pair started a major decline below the 0.7600 level.
There was a clear move below the 0.7600 and 0.7580 support levels. The pair even declined below the 0.7550 support level and the 50 hourly simple moving average. Besides, there was a break below a key bullish trend line with support near 0.7530 on the hourly chart of AUD/USD.
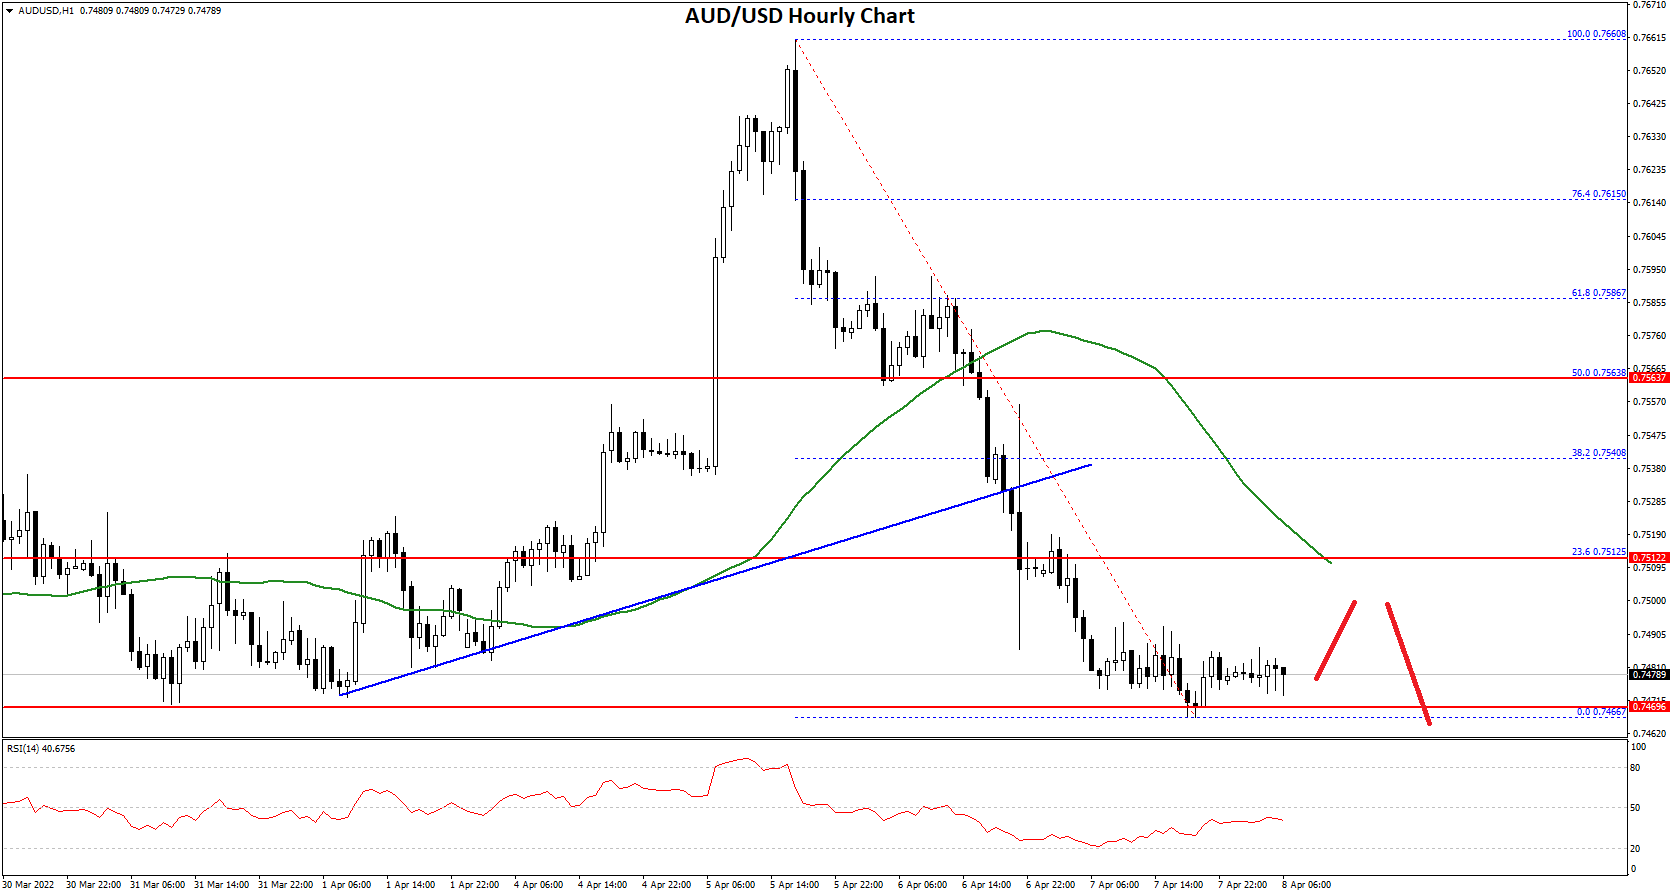
The pair traded as low as 0.7466 on FXOpen and is currently consolidating losses. On the upside, the AUD/USD pair is facing resistance near the 0.7500 level.
The next major resistance is near the 0.7515 level. It is near the 23.6% Fib retracement level of the recent decline from the 0.7660 swing high to 0.7466 low. The first major resistance is now forming near the 0.7550 level.
The 50% Fib retracement level of the recent decline from the 0.7660 swing high to 0.7466 low is also near the 0.7565 level. A close above the 0.7565 level could start a steady increase in the near term. The next major resistance could be 0.7660.
On the downside, an initial support is near the 0.7460 level. The next support could be the 0.7420 level. If there is a downside break below the 0.7420 support, the pair could extend its decline towards the 0.7350 level. Any more downsides might send the pair toward the 0.7300 level.
NZD/USD Technical Analysis
The New Zealand Dollar also followed a similar path from the 0.7030 zone against the US Dollar. The NZD/USD pair gained pace below the 0.6980 support zone.
The pair traded below the 0.6950 and 0.6920 support levels. Besides, there was a move below a key bullish trend line with support near 0.6950 on the hourly chart of NZD/USD. The pair even broke the 0.6900 level and traded as low as 0.6871.
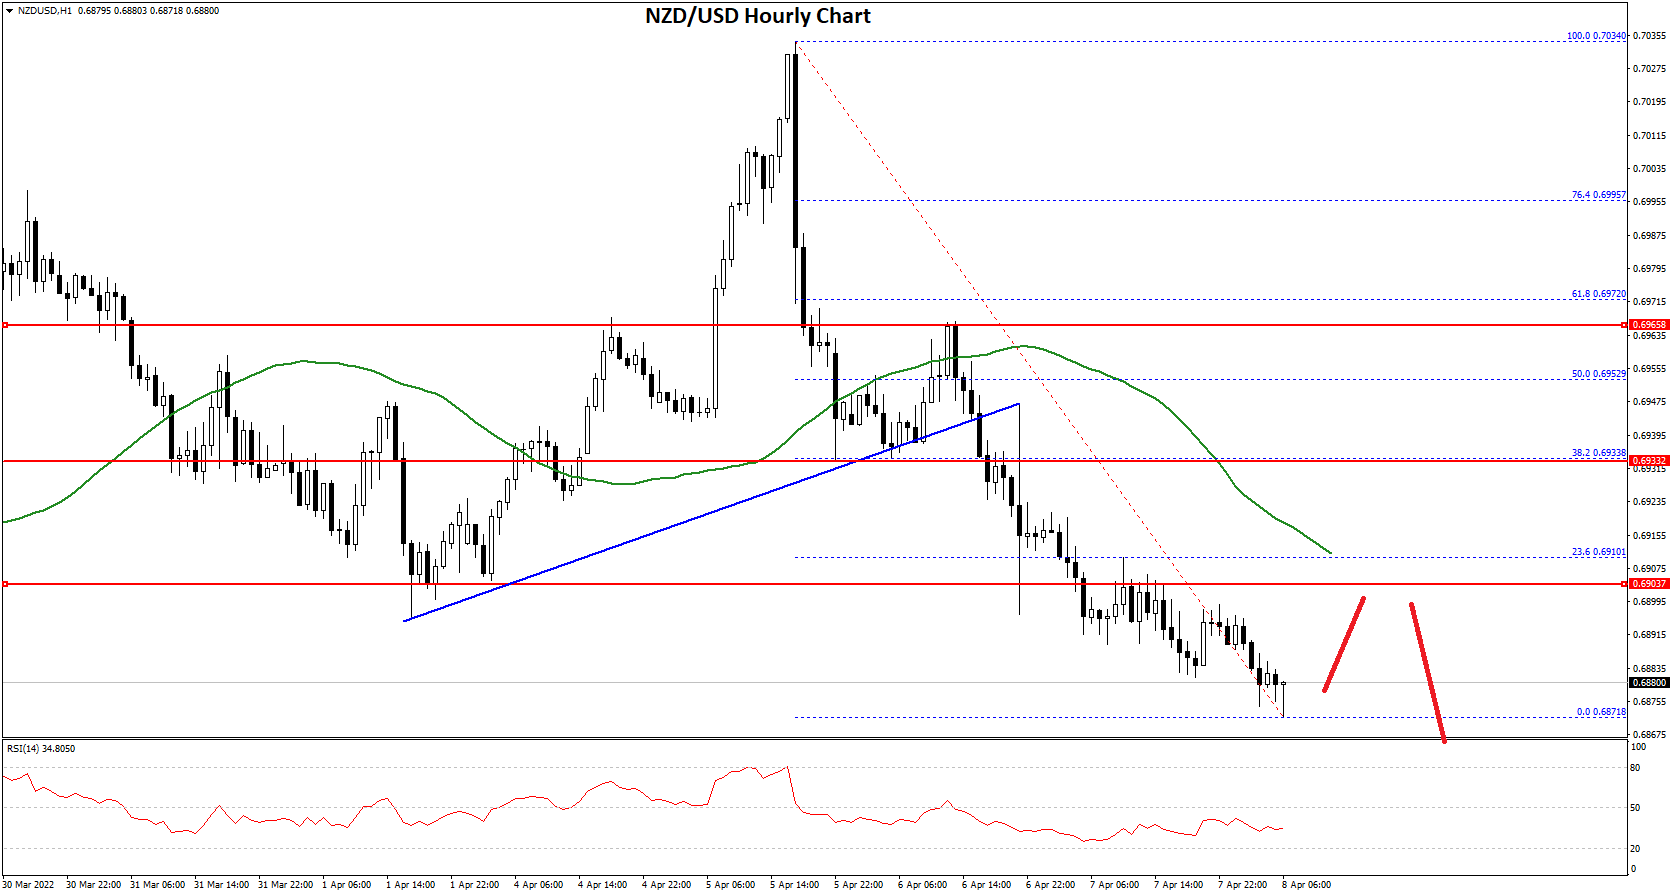
On the upside, an initial resistance is near the 0.6890 level. The next major resistance is near the 0.6910 level. It is near the 23.6% Fib retracement level of the recent decline from the 0.7034 swing high to 0.6871 low.
The first major resistance is now forming near the 0.6935 level. It is close to the last breakdown zone and the 38.2% Fib retracement level of the recent decline from the 0.7034 swing high to 0.6871 low.
A clear move above the 0.6935 level might even push the pair towards the 0.7000 level. On the downside, an initial support is near the 0.6880 level. The next support could be the 0.6850 zone. If there is a downside break below the 0.6850 support, the pair could extend its decline towards the 0.6780 level.
This forecast represents FXOpen Markets Limited opinion only, it should not be construed as an offer, invitation or recommendation in respect to FXOpen Markets Limited products and services or as financial advice.
Trade over 50 forex markets 24 hours a day with FXOpen. Take advantage of low commissions, deep liquidity, and spreads from 0.0 pips (additional fees may apply). Open your FXOpen account now or learn more about trading forex with FXOpen.
This article represents the opinion of the Companies operating under the FXOpen brand only. It is not to be construed as an offer, solicitation, or recommendation with respect to products and services provided by the Companies operating under the FXOpen brand, nor is it to be considered financial advice.
Stay ahead of the market!
Subscribe now to our mailing list and receive the latest market news and insights delivered directly to your inbox.


Latest articles

Pound at Key Levels: Markets Assess Impact of Political Uncertainty in the UK
The British pound remains under pressure following increased political uncertainty in the United Kingdom triggered by the Prime Minister’s resignation. Investors are assessing potential shifts in the political and economic policy outlook after the head of government stepped down,

Silver: Fed Tightens Its Tone as Price Returns to the Volume Profile Zone
Silver came under pressure following the Federal Reserve’s June meeting, at which policymakers kept interest rates unchanged at 3.50–3.75%. Nine of the 18 committee members still see the possibility of a rate increase this year, reinforcing

Ethereum: Market Assesses the Strength of the Corrective Recovery
Following a period of heightened volatility in early June, investor attention in Ethereum has once again shifted towards institutional demand and the development of the spot ETF market in the United States. The funds launched last year continue to serve