


FXOpen
AUD/USD declined recently and broke the 0.7150 support area. NZD/USD dropped heavily below 0.6800 and now recoveries are likely to face solid hurdles on the upside.
Important Takeaways for AUD/USD and NZD/USD
- The Aussie Dollar started a major downside move from 0.7200 and declined below 0.7150 against the US Dollar.
- There was a break below a major bullish trend line with support at 0.7170 on the hourly chart of AUD/USD.
- NZD/USD also fell significantly and broke the 0.6800 support area.
- There was a break below a key bullish trend line with support at 0.6810 on the hourly chart.
AUD/USD Technical Analysis
There were multiple failures near the 0.7245-0.7250 zone in the Aussie Dollar against the US Dollar. The AUD/USD pair started a major downside move and broke the 0.7200 and 0.7150 support levels.
The decline was such that the pair even broke the 0.7120 support level and the 50 hourly simple moving average. Moreover, there was a break below a major bullish trend line with support at 0.7170 on the hourly chart.
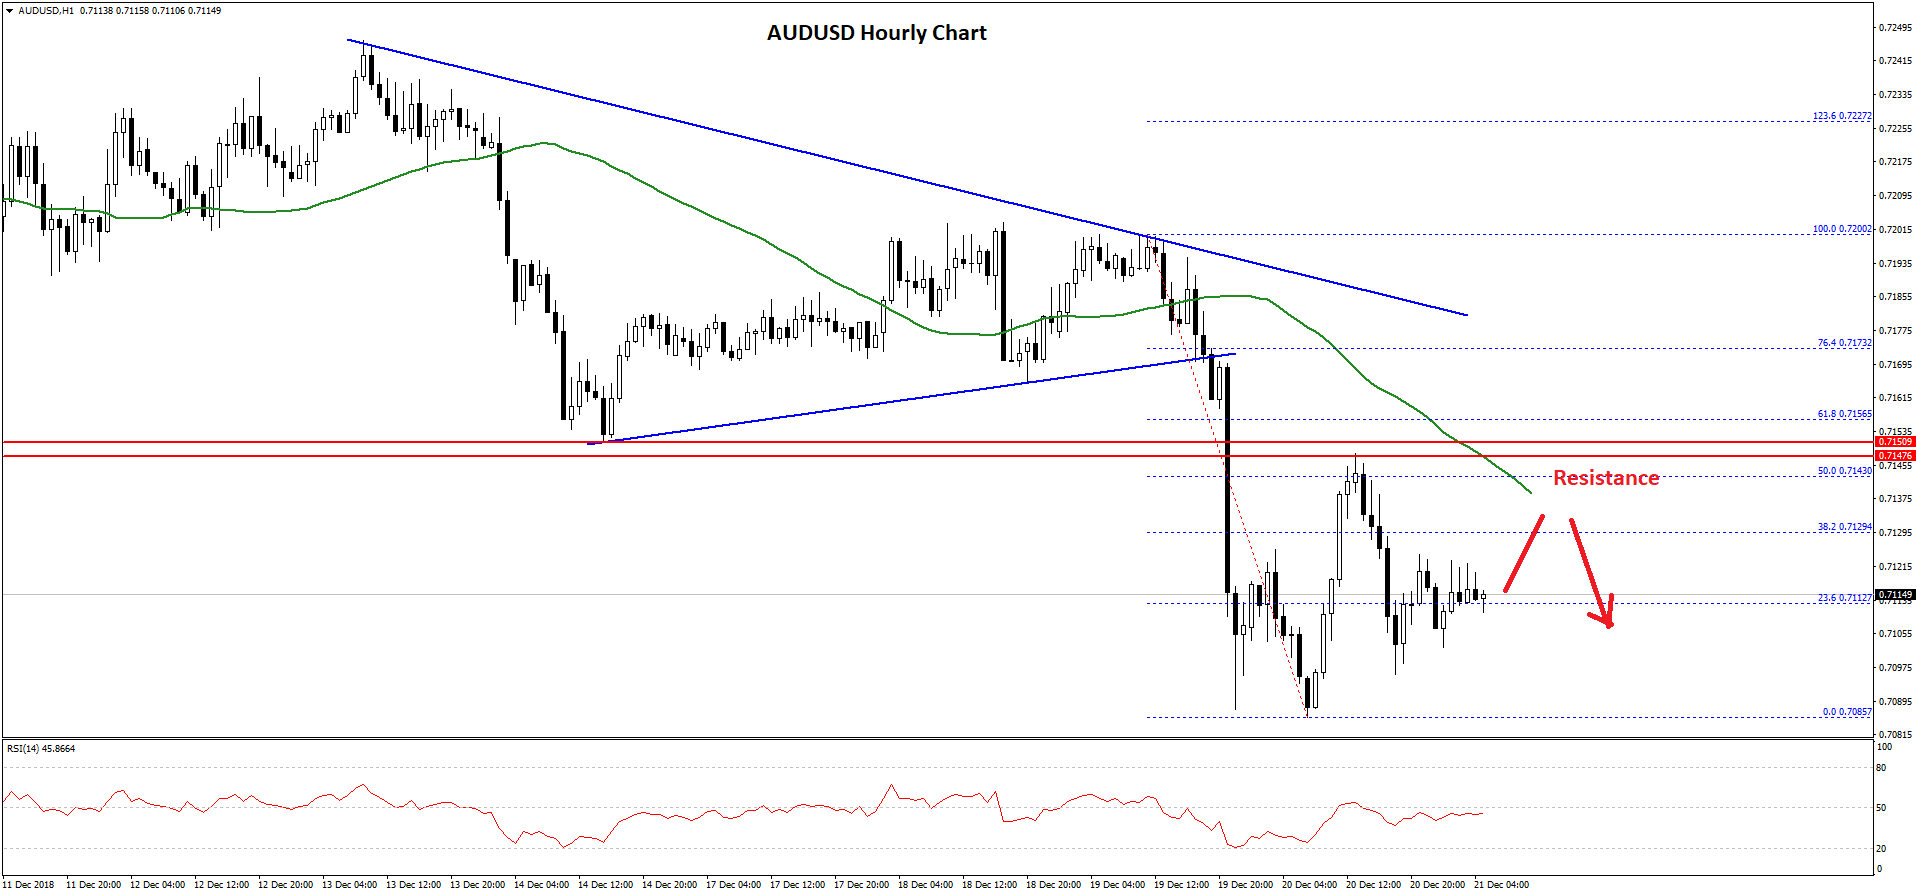
Finally, there was a push below the 0.7100 level and a low was formed at 0.7085 FXOpen. Later, the pair started an upside correction and traded above the 0.7120 level and the 38.2% Fib retracement level of the last drop from the 0.7200 high to 0.7085 low.
However, the upside move was capped by the 0.7145-0.7150 resistance zone, which was a support earlier. Moreover, the pair was rejected near the 50% Fib retracement level of the last drop from the 0.7200 high to 0.7085 low.
The pair declined once again and it is currently trading near the 0.7110 level. On the upside, there are many hurdles near the 0.7140, 0.7150, and the 50 hourly simple moving average.
Therefore, as long as the pair is below the 0.7150 resistance, it is likely to struggle. On the downside, a break below the 0.7100 support may call for more losses below the 0.7085 low in the near term.
NZD/USD Technical Analysis
After struggling a lot near the 0.6880 resistance area, the New Zealand Dollar started a downside move against the US Dollar. The NZD/USD pair broke the 0.6850 and 0.6820 support levels to move into a bearish zone.
During the decline, there was a break below a key bullish trend line with support at 0.6810 on the hourly chart. The pair settled below the 0.6800 support and the 50 hourly simple moving average.
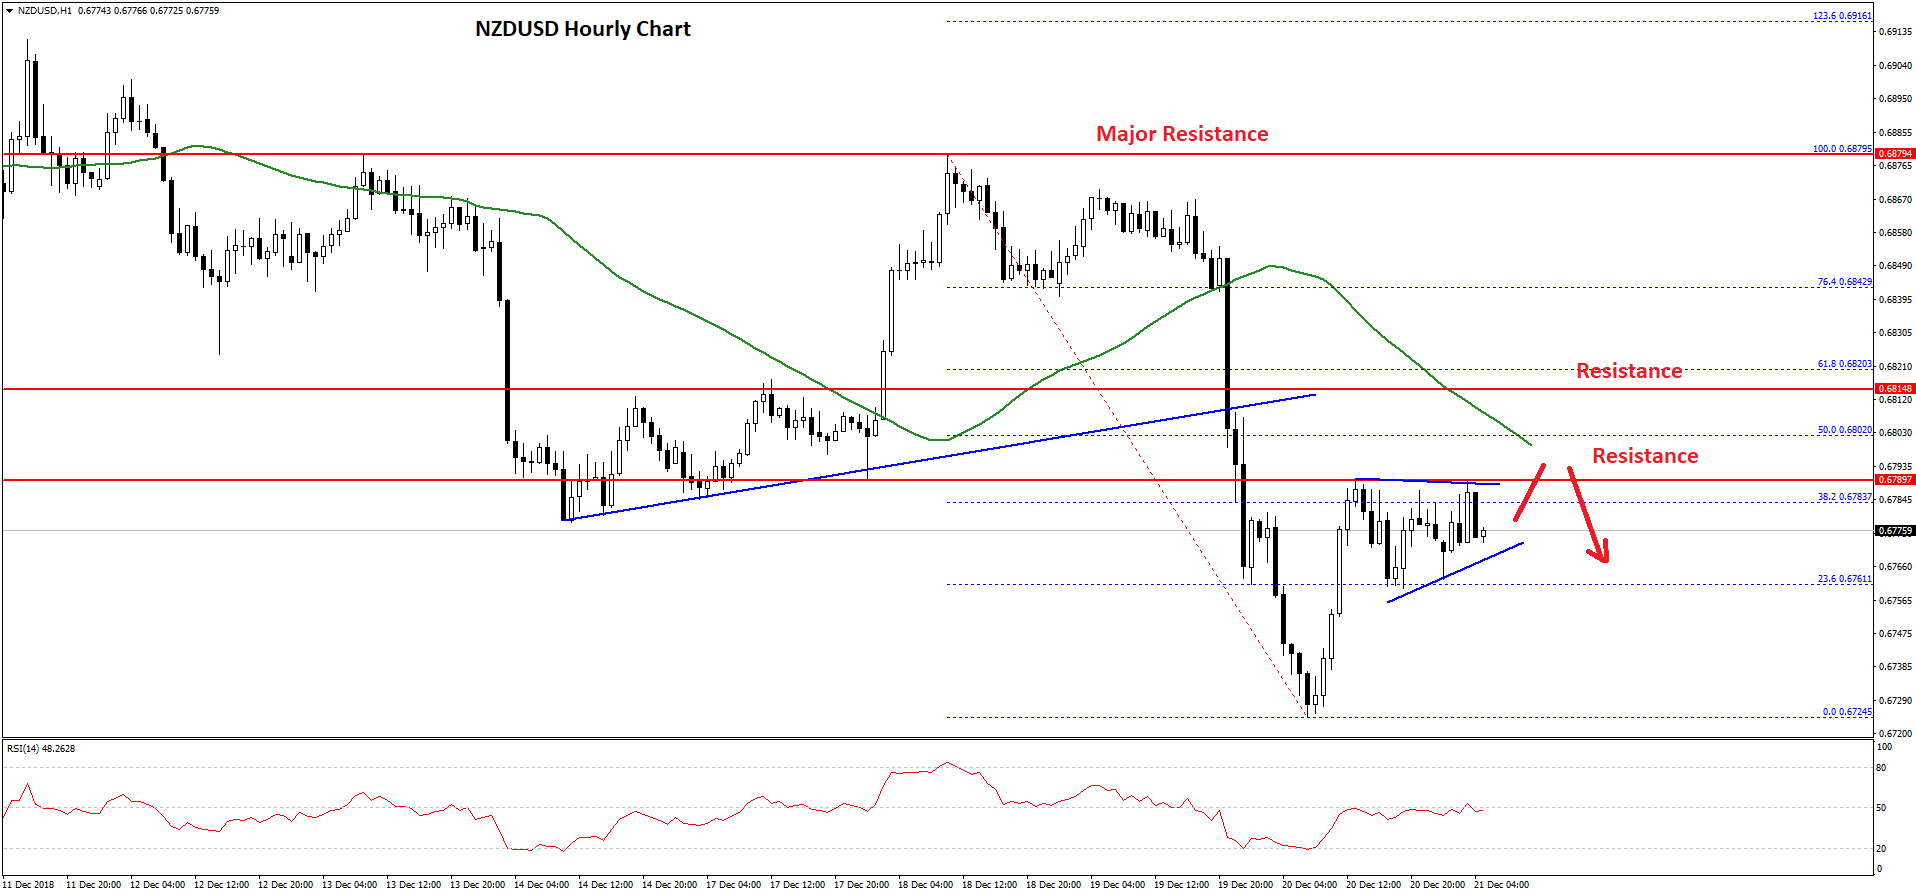
A new weekly low was formed at 0.6724 and later the pair corrected higher. It moved above the 0.6760 level and the 23.6% Fib retracement level of the recent decline from the 0.6879 high to 0.6724 low.
However, the pair is facing a solid resistance near the 0.6790 level. Above 0.6790, the next resistance is near the 0.6800 level and the 50% Fib retracement level of the recent decline from the 0.6879 high to 0.6724 low.
The 50 hourly simple moving average is also around the 0.6800 barrier. Therefore, as long as the pair is below the 0.6800 resistance, it is likely to resume its decline. If there is a close above 0.6800, the pair may bounce back towards the 0.6840 level.
On the downside, the main support is at 0.6760, below which the NZD/USD pair could decline towards the 0.6725 support area.
Trade over 50 forex markets 24 hours a day with FXOpen. Take advantage of low commissions, deep liquidity, and spreads from 0.0 pips. Open your FXOpen account now or learn more about trading forex with FXOpen.
This article represents the opinion of the Companies operating under the FXOpen brand only. It is not to be construed as an offer, solicitation, or recommendation with respect to products and services provided by the Companies operating under the FXOpen brand, nor is it to be considered financial advice.
Stay ahead of the market!
Subscribe now to our mailing list and receive the latest market news and insights delivered directly to your inbox.

Latest from Forex Analysis
Latest articles

Weekly Market Wrap With Gary Thomson: Nasdaq, EUR/USD, USD/CHF, Brent Crude Oil, Googl Shares
Get the latest scoop on the week's hottest headlines, all in one convenient video. Join Gary Thomson, the COO of FXOpen UK, as he breaks down the most significant news reports and shares his expert insights.
- Nasdaq Composite: Worst Session

Analysis of AUD/USD: Exchange Rate Falls to Early May Low
As indicated by the 4-hour AUD/USD chart today:
→ the rate fell below 0.652, a level last seen on May 2;
→ the RSI indicator dropped below 15, a level last seen during the panic over the spread of COVID-19

Analysis of AMZN Stock: Price at 1.5-Month Low
As shown in the AMZN chart, the stock price dropped below:
→ the psychological level of $180;
→ the mid-June interim low.
The last time AMZN traded below $180 was in early June.
Thus, AMZN has faced sell-offs, similar to other tech