


AUD/USD: Double Top Pattern Hints At Steep Losses
FXOpen
The Australian Dollar (AUD) fell broadly against the US Dollar (USD) on Tuesday, dragging the AUD/USD to less than 1.9270. The pair printed a Lower High (LH) on the daily chart, turning the short term sentiment to bearish. Moreover, a classic double top pattern has also emerged on the daily timeframe; a breakout through the neckline could spur huge selling pressure in the Aussie Dollar.
Technical Analysis
As of this writing, the pair is being traded around 1.9270. A support can be seen near 1.9250, the 55 Simple Moving Average and psychological level ahead of 1.9150-75, the 38.2% fib level and 200 SMA and then 1.9200 that is the psychological level and swing low of the previous wave as demonstrated in the following chart. Not to mention, 1.9202 is also the neckline of the double top pattern. Neckline is the lowest point between the two tops of the price pattern; traders tend to sell the asset on a break below the neckline.
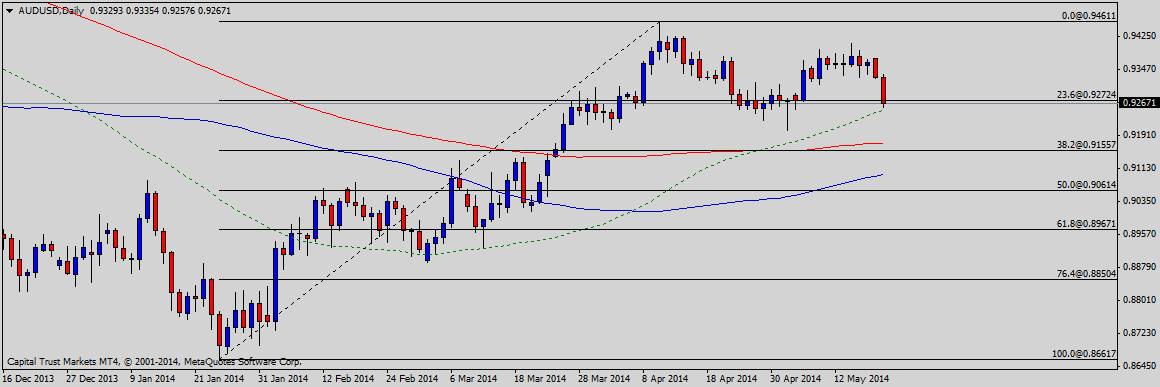
On the upside, the pair is expected to face a hurdle around 1.9335, the intraday high of today ahead of 1.9409, the swing high of the most recent rally and then 0.9461, the high of the last major rally. A failure to break the neckline would expose 0.9500 in the near future.
Wage Price Index
Tomorrow the Australian Bureau of Statistics will release the wage price index. According to the median projection of various economists, the wage price index gained by 2.6% during the first four months of the ongoing year as compared to the same increase in the same duration of the year before, better than expected actual outcome will be considered bullish for AUD/USD and vice versa.
Conclusion
Considering the overall technical and fundamental outlook, selling the pair on a break below the neckline appears to be a good strategy, the trade should however be stopped out on a daily closing back above the neckline.
Trade over 50 forex markets 24 hours a day with FXOpen. Take advantage of low commissions, deep liquidity, and spreads from 0.0 pips (additional fees may apply). Open your FXOpen account now or learn more about trading forex with FXOpen.
This article represents the opinion of the Companies operating under the FXOpen brand only. It is not to be construed as an offer, solicitation, or recommendation with respect to products and services provided by the Companies operating under the FXOpen brand, nor is it to be considered financial advice.
Stay ahead of the market!
Subscribe now to our mailing list and receive the latest market news and insights delivered directly to your inbox.


Latest articles

EUR/USD and GBP/USD consolidate ahead of the Fed decision
European currencies are showing subdued dynamics, entering a consolidation phase following their previous advance. Earlier, EUR/USD and GBP/USD broke out of their ranges and strengthened; however, the subsequent correction has led both pairs to retest the previously breached

Meta: V-Shaped Recovery Meets Heavy Volume Resistance
The movement in Meta Platforms shares is being driven by two competing narratives. On one hand, advertising revenue is benefiting from AI-based tools: the Advantage+ platform continues to support strong advertiser demand, and the analyst consensus for Q1 2026 revenue

Commodity Currencies Test Key Levels Ahead of Major Macro Data
Commodity-linked currencies are trading near key levels, showing restrained price action as market participants adopt a wait-and-see approach. The fundamental backdrop is shaped by expectations surrounding the release of Australia’s inflation data and the Bank of Canada’s interest