


AUD/USD Eyes 0.8762 As Bulls Gain Momentum
FXOpen
The Aussie Dollar extended upside movement against the greenback on Monday after the appearance of bullish engulfing bar on the daily chart. The overall bias is however still bearish due to a Lower Low on the daily chart.
Technical Analysis
The AUD/USD opened the Asian session at 0.8644. As of this writing, the pair is being traded around 0.8663. The price is likely to face the first resistance around 0.8762, the high of November 5 and trend-line as demonstrated in the following chart. Then the pair might test the next milestone around 0.8850 that acted as resistance on various occasions during last month.
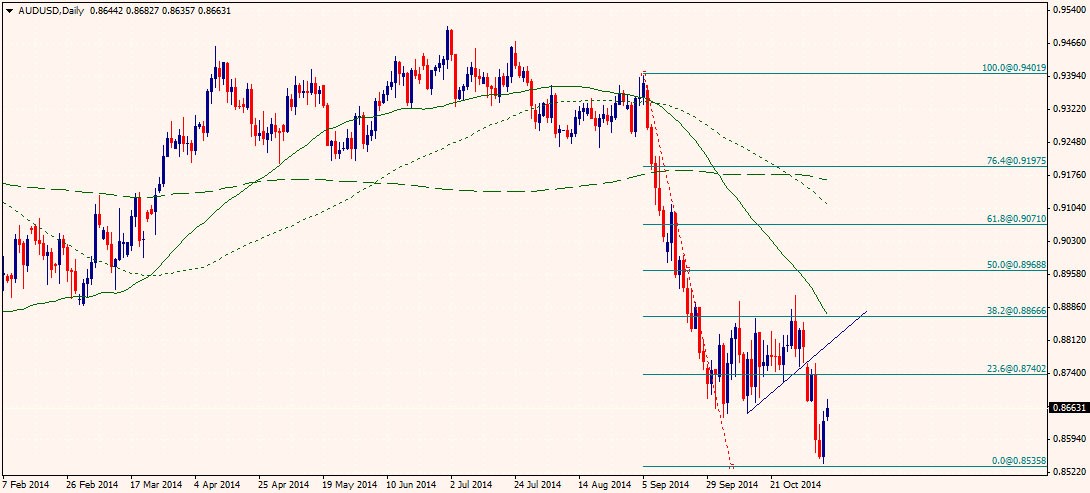
On the downside, the pair may find a support around the 0.8642-0.8650 zone. The next support lies at 0.8550, the psychological number and yesterday’s low. However, a daily closing above 0.8654 will confirm the bullish momentum that might continue over the next couple of days taking the price up to 0.8675, as indicated by the confluence of trendline and 50-day SMA.
Australia Home Loans
This September the Australian home loans remained -0.7%, exceeding 1.0%, the figure for the month before, as released by the Australian Bureau of Statistics. A high reading is considered positive for the Aussie Dollar and vice versa, thus a better than expected actual figure spurred bullish momentum in the price of AUDUSD.
Trading Strategy
Considering the overall technical and fundamental outlook, buying the pair on a daily close above the 0.8650 resistance could be a good strategy in short to medium term. The trade should however be stopped out on a daily closing back below the 0.8650 support area.
Trade over 50 forex markets 24 hours a day with FXOpen. Take advantage of low commissions, deep liquidity, and spreads from 0.0 pips (additional fees may apply). Open your FXOpen account now or learn more about trading forex with FXOpen.
This article represents the opinion of the Companies operating under the FXOpen brand only. It is not to be construed as an offer, solicitation, or recommendation with respect to products and services provided by the Companies operating under the FXOpen brand, nor is it to be considered financial advice.
Stay ahead of the market!
Subscribe now to our mailing list and receive the latest market news and insights delivered directly to your inbox.


Latest articles

US Dollar Index: A Defining Week for the King of the Markets
The dollar heads into a pivotal week trading near 101.80, just off a 15-month high, with the Fed's July 29 meeting standing as the clear focal point. Markets currently price roughly a 65% chance of a hold, though renewed

NZD/USD: Inflation Surge Meets Strong US Dollar Pressure
On 21 July, Stats NZ reported an acceleration in inflation: the Consumer Price Index rose 1.5% in the second quarter, while the annual inflation rate climbed to 4.1%, its highest level in more than two years and slightly

Weekly Market Insights with Gary Thomson: The Week of Central Banks and Earnings
In this video, we’ll explore the key economic events and market trends, shaping the financial landscape. Get ready for insights into financial markets to help you navigate the week ahead. Let’s dive in!
In this episode of Market