


FXOpen
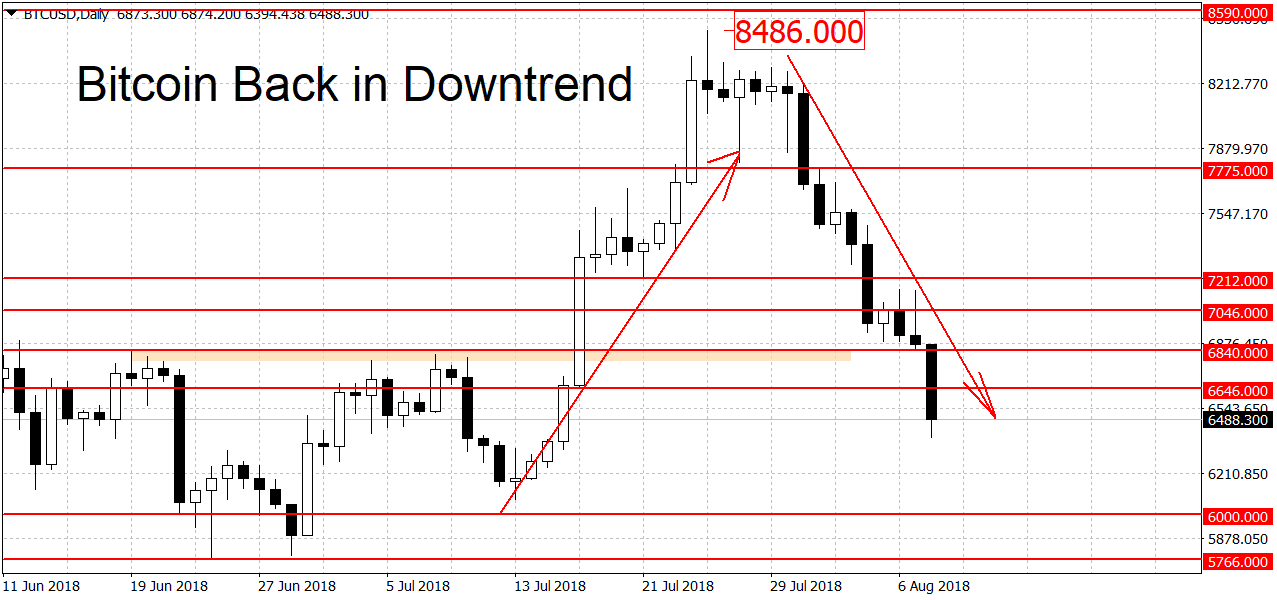
Bitcoin prices are back in a downtrend after falling 10 percent after yesterday’s SEC decision. Litecoin followed suit, breaking out from its range and starting its own bearish trend.
Bitcoin Down After Delayed ETF Decision
Bitcoin prices dropped close to 10 percent in the past 14 hours. The main catalyst behind the news was the U.S. Securities and Exchange Commission delaying a decision on the VanEck-SolidX ETF until September. While this may not seem like such a bad decision, this is exactly how the SEC treated the Winklevoss ETF. That decision was delayed for years, exhausting all legal delay options, then ultimately refused early last year.
Today’s delay comes only 11 days after the SEC rejected the Winklevoss ETF for the second time. As we noted in our article back then, based on the reasons given by the agency, the VanEck-SolidX bid in August should be dead in the water too.
Technically BTC/USD is now back in a downtrend. To end it as well as start a new rally the bulls need a breakout above last month’s high at $8,486 dollars. Below current prices, there’s some support in the $5,766 to $6,000 area. A decisive clearing of this area should open the door to the $5,000 round figure. On the longer-term charts, bitcoin is mixed. The weekly charts are bearish but the monthly is still keeping a slightly bullish bias.
Litecoin Breaks Out of Range
Litecoin finally broke out of its 43-day range. The crypto fell through the $72.50 floor yesterday right as bitcoin was dropping on the ETF news. We are currently trading at $65.53 dollars, down by $8.79 or 11.8 percent.
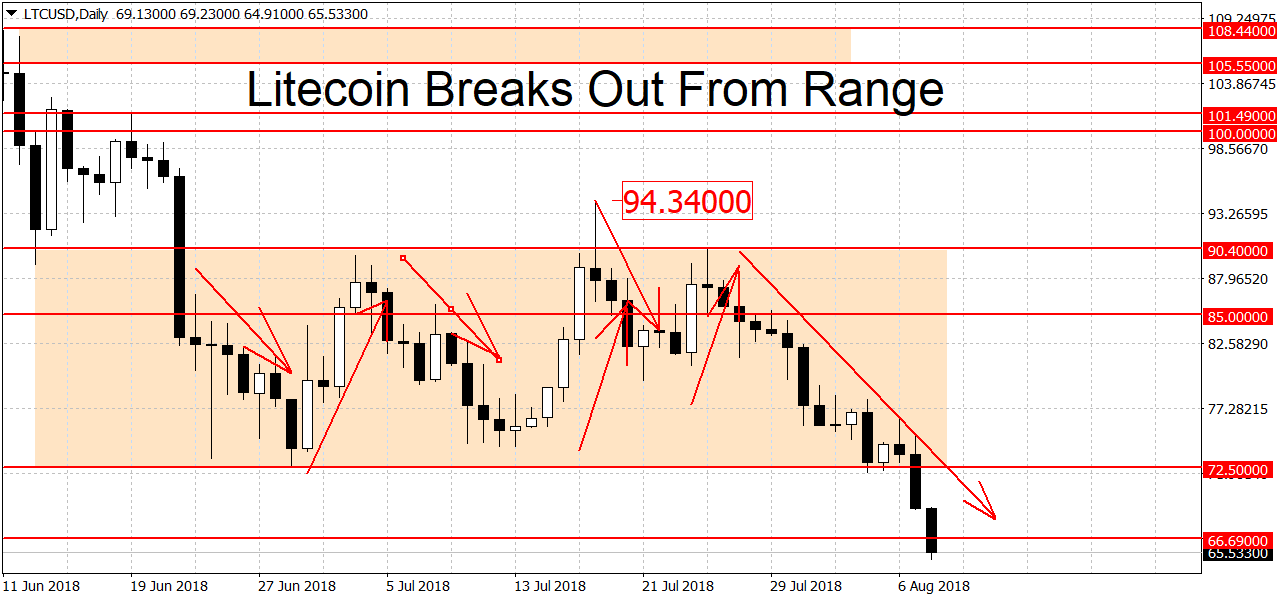
Similarly to bitcoin, the technical picture in LTC/USD is bearish as well. A breakout above $85 dollars is needed to end the new trend while a move beyond $90.40 could start an uptrend. Below current prices, there’s weak support around $60 and $55 dollars, followed by a much stronger level around $50 dollars per coin.
Here we have the 2013 high at $48.40 dollars coupled with the $50 round figure. That 2013 high wasn’t broken until July of 2017. A clean break below $48.40 could lead to extended losses. On the longer-term charts, the picture is the same as bitcoin, bearish on the weeklies but slightly bullish on the monthly charts.
Trade bitcoin on Forex with FXOpen broker.
FXOpen offers the world's most popular cryptocurrency CFDs*, including Bitcoin and Ethereum. Floating spreads, 1:2 leverage — at your service (additional fees may apply). Open your trading account now or learn more about crypto CFD trading with FXOpen.
*Important: At FXOpen UK, Cryptocurrency trading via CFDs is only available to our Professional clients. They are not available for trading by Retail clients. To find out more information about how this may affect you, please get in touch with our team.
This article represents the opinion of the Companies operating under the FXOpen brand only. It is not to be construed as an offer, solicitation, or recommendation with respect to products and services provided by the Companies operating under the FXOpen brand, nor is it to be considered financial advice.
Stay ahead of the market!
Subscribe now to our mailing list and receive the latest market news and insights delivered directly to your inbox.


Latest articles

NVDA Shares Approach Key Resistance
Nvidia’s chip production is concentrated with Taiwanese contractor TSMC, increasing the company’s exposure to geopolitical risks and US export policy. Restrictions on shipments to China, including decisions related to H20-series chips, have led to significant financial adjustments, which

EUR/USD and GBP/USD at Range Boundaries Ahead of Geopolitical Decisions
European currencies are entering a consolidation phase following an attempted recovery, while market participants adopt a wait-and-see approach amid uncertainty surrounding the geopolitical landscape. Current price action reflects a balance between a softer US dollar and a lack of sustained

Market Analysis: Gold Price Slips Back, WTI Crude Oil Rally Gains Fresh Strength
Gold price rallied above $4,750 before correcting lower. Crude oil prices are rising and could climb further higher toward $110.00.
Important Takeaways for Gold and WTI Crude Oil Prices Analysis Today
· Gold price gained pace for a move