


S&P 500 Shows Indecision Near All-Time High
FXOpen

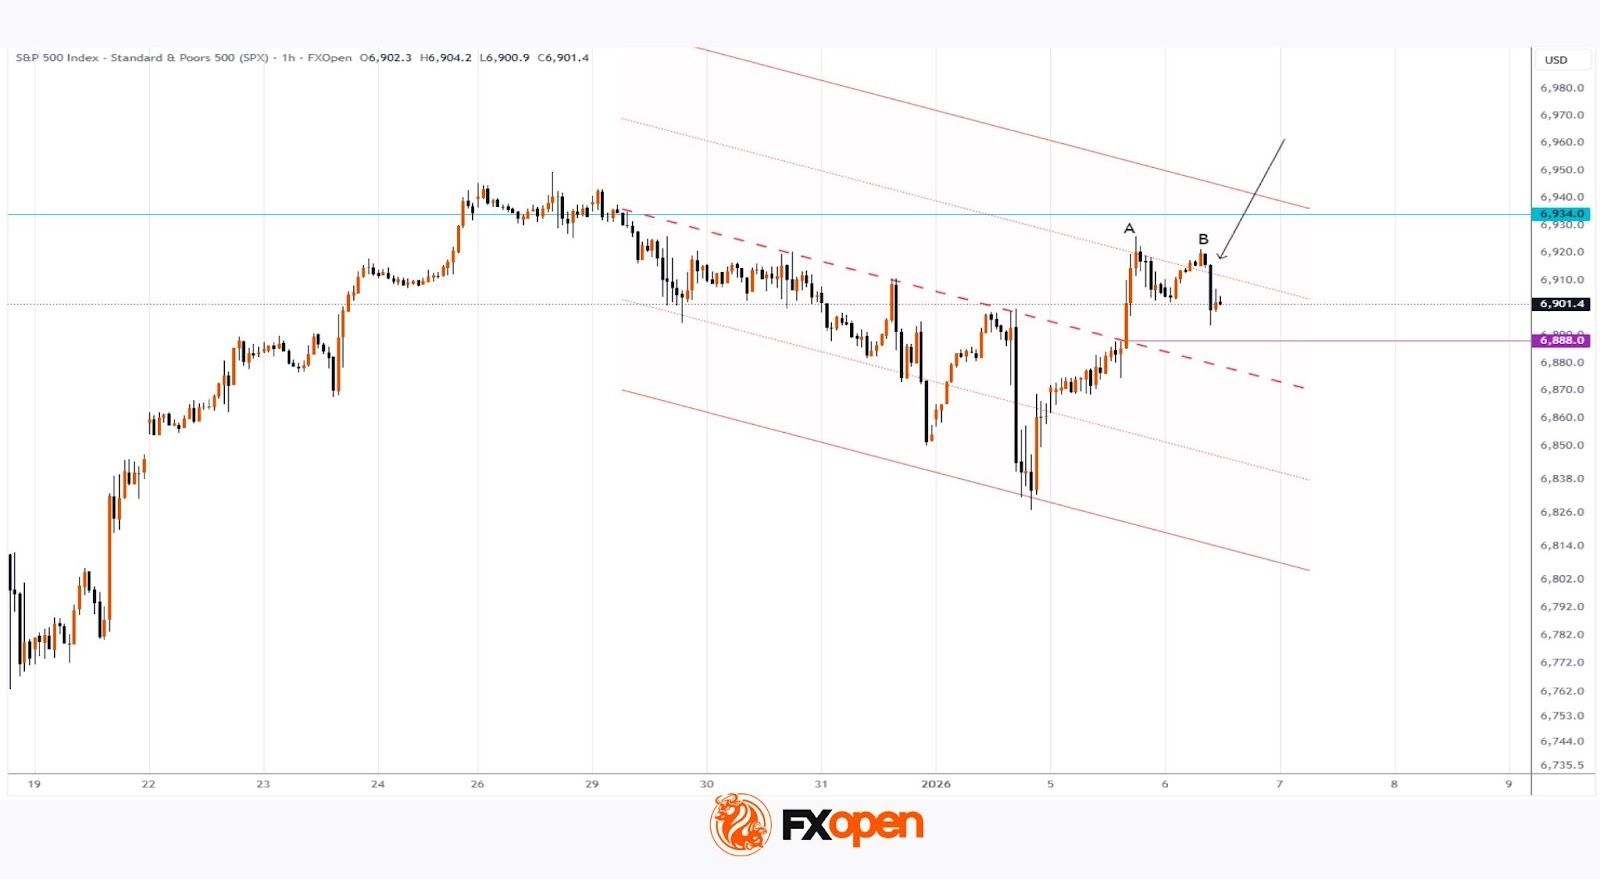
As the S&P 500 chart (US SPX 500 mini on FXOpen) shows, this morning the price approached yesterday’s high at A, but then sharply reversed downward (indicated by the arrow), forming a lower low at B.
This resembles a Double Top pattern, which can be interpreted as market indecision near the all-time high. Traders are weighing risks and opportunities that depend on US actions in Venezuela:
- Bullish factor: access to the country’s resources could act as a growth driver for the US economy. Yesterday, financials and energy sectors were the strongest performers.
- Bearish factor: related to geopolitical risks and the potential involvement of the US in a protracted conflict.
E-mini S&P 500 Technical Analysis
On 29 December, we noted the indecision of bulls around the 6934 level, as the price showed no signs of firmly holding the record highs. We also considered a scenario in which the S&P 500 (US SPX 500 mini on FXOpen) might decline.
Since then, the trend has largely been bearish, and a descending channel can be drawn, with:
- The median (dashed line) passing through lower highs.
- Yesterday’s move into the upper half of the channel appearing aggressive, given the sharp surge from 6888.
This level may act as support for bulls on their way toward the upper boundary of the channel.
On the other hand, a bearish break of the 6888 level:
- would provide an additional signal of demand indecision;
- would reinforce the descending channel’s relevance as a market reference.
Trade global index CFDs with zero commission and tight spreads (additional fees may apply). Open your FXOpen account now or learn more about trading index CFDs with FXOpen.
This article represents the opinion of the Companies operating under the FXOpen brand only. It is not to be construed as an offer, solicitation, or recommendation with respect to products and services provided by the Companies operating under the FXOpen brand, nor is it to be considered financial advice.
Stay ahead of the market!
Subscribe now to our mailing list and receive the latest market news and insights delivered directly to your inbox.


Latest articles

Weekly Market Insights with Gary Thomson: US Inflation, UK GDP, Chair Warsh Testimony, and Earnings
In this video, we’ll explore the key economic events and market trends, shaping the financial landscape. Get ready for insights into financial markets to help you navigate the week ahead. Let’s dive in!
In this episode of Market

GBP/AUD Analysis: The Tug-of-War Begins
Oil is back in the driver's seat, and both the pound and the aussie are feeling its grip. The Bank of England held rates at 3.75% in June, but with UK inflation at 2.8% and crude oil climbing

Australian Dollar Holds Above the Current Market Profile
The minutes from the Reserve Bank of Australia's (RBA) June meeting, released on 30 June, suggested that policymakers are not yet ready to rule out further policy tightening. Board members noted persistent excess demand and broad-based inflationary pressures across the