


FXOpen
There have been a lot of developments in the past week, since our last update on BTC/LTC. Bitcoin finally broke out of its range yesterday and hit a low of $222.23 today. Meanwhile Litecoin started its downmove one day earlier on May 31st, by losing close to 10 percent. But let’s start with big brother first.
Bitcoin Breaks $230 Dollars
After spending the entire last month of May tucked in a range, bitcoin finally broke out yesterday. The break of support at $230 dollars led to a more lower to $222.23 today. So far no large losses have transpired and we are currently quoted at $226.39, just $4 dollars below the previous support.
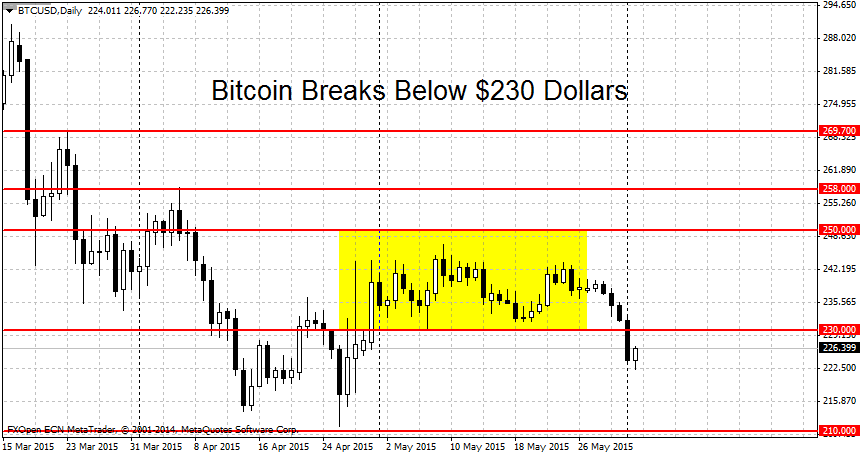
While volatility is picking up, yesterday’s losses of $8 d0llars are still low by historical standards. To generate a momentum to the downside, the bears will have to do much better than this. The tentative downtrend could be in jeopardy if the bulls recover and push prices back above $235-$240 dollars per coin. But technically the downtrend will remain in place until $247 gives way as well.
The first notable support on the lower end is at $210 dollars. As can be seen on the chart above, this is a formed double bottom for the cryptocurrency. Below here the round $200 dollars mark may offer support to falling prices. However if the bears manage to push prices below $200, the losses could intensify.
Litecoin Gives Up Gains
Litecoin gave up most of the gains from the May 22nd rally. The decline on May 31st took prices from $1.814 to $1.639, a 9.6% loss in a single session. We have since stabilized somewhat with LTC/USD trading at $1.6320 right now.
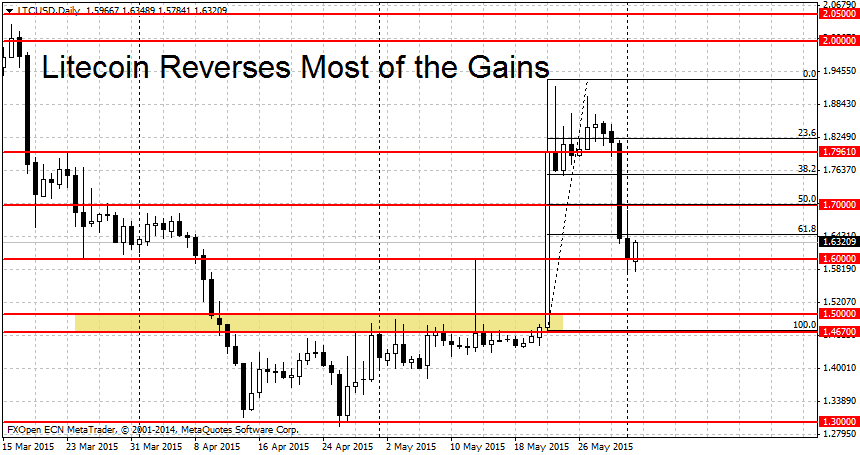
The uptrend for Litecoin is still technically in place and we need to see prices make a decisive break below $1.60 to end it. Yesterday’s low at $1.5784 came close but prices quickly reversed back above the $1.60 mark. But with bitcoin now in a downtrend and LTC suffering a one-day loss of 10%, caution is advised on the long side.
Here are some resistance levels if the bulls manage to stabilize the situation and support prices. First we have the March 28th swing high near $1.70. This may be a weak resistance because it didn’t provide any support to falling prices. Higher up we find the March 23rd high near $1.80 ($1.796 to be exact). As we can see on the chart above, this general area is where the current rally stalled. Higher still, the spike high of the rally at $1.93 may also offer resistance, followed by the round $2 dollars mark. On the downside, notable support levels can be found at $1.60, followed by $1.50 and $1.38.
FXOpen offers the world's most popular cryptocurrency CFDs*, including Bitcoin and Ethereum. Floating spreads, 1:2 leverage — at your service (additional fees may apply). Open your trading account now or learn more about crypto CFD trading with FXOpen.
*Important: At FXOpen UK, Cryptocurrency trading via CFDs is only available to our Professional clients. They are not available for trading by Retail clients. To find out more information about how this may affect you, please get in touch with our team.
This article represents the opinion of the Companies operating under the FXOpen brand only. It is not to be construed as an offer, solicitation, or recommendation with respect to products and services provided by the Companies operating under the FXOpen brand, nor is it to be considered financial advice.
Stay ahead of the market!
Subscribe now to our mailing list and receive the latest market news and insights delivered directly to your inbox.


Latest articles

Alibaba (BABA) Shares Drop Approximately 10% Over the Week
Last Wednesday, the closing price of Alibaba (BABA) shares was $152.28, while the closing price yesterday was $135.59, marking a 2026 low.
The roughly 10% decline was driven by a combination of bearish factors, including:
→ Unexpected resignation of

Market Analysis: Gold Under Pressure as WTI Crude Extends Rally During Iran War
Gold price extended losses below $5,100 before the bulls appeared. WTI Crude oil prices are rising and could climb further higher toward $80.00.
Important Takeaways for Gold and WTI Crude Oil Prices Analysis Today
· Gold price failed to

Dollar Strengthens on Middle East Tensions
The dollar strengthened as geopolitical tensions in the Middle East intensified. Heightened uncertainty traditionally boosts demand for safe-haven assets and dollar liquidity, supporting the US currency against a range of peers. An additional factor remains the resilience of US macroeconomic