


Bitcoin Enters Uptrend After Rally
FXOpen
After several weeks of range-bound trading, bitcoin finally managed to string together some gains. Prices are up $34 dollars since bottoming out at $374.08 last Tuesday. Meanwhile its little brother Litecoin is gaining ground as well, albeit to a lesser extent. But let’s start with bitcoin first.
Bitcoin Downtrend Ends
During the weekend BTC prices broke past the $392.50 swing high, ending the previous downtrend. And today we look set to break to new highs as bitcoin enters rally territory. On the chart below this slow creep higher is clearly visible. What are some of the important levels to watch?
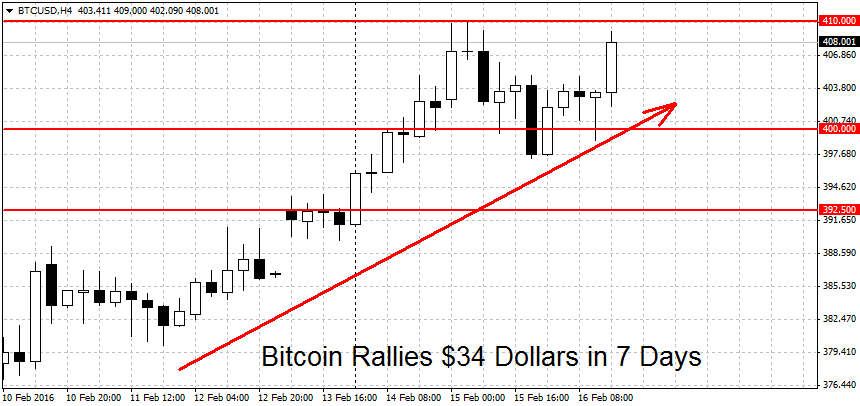
On the upside weak resistance can be found near the round $410 figure. The high reached two days ago stands at $409.93 on FxOpen. A stronger resistance level can be found bit higher up at $425.50 dollars per coin, followed by the round $450 figure. Above here we find an important level near $460 dollars per coin. A decisive breakout above here could extend the gains toward the round $500 resistance level, last year’s high for BTC/USD.
On the lower end, we have some support near another round level, $400 dollars. Prices bounced close to this level today at $397.30 before heading higher. But to end the current uptrend, the bears will have to push prices below the $374.08 swing low. We have more levels on the way down at $365 dollars, followed by the $350 dollars swing low reached back in January.
Litecoin Still Stuck in a Range
Despite bitcoin’s gains, alternative cryptocurrency Litecoin is still stuck in a range. In the past week, LTC prices have gained just over 3 percent, from $3.06 to $3.16 dollars per coin. This compares to BTC gains of $34 dollars, or 9 percent. The under-performance of LTC/USD can be demonstrated with the 4 Hour chart below. Compare this slightly rising pair with the chart of bitcoin’s strong rally above.
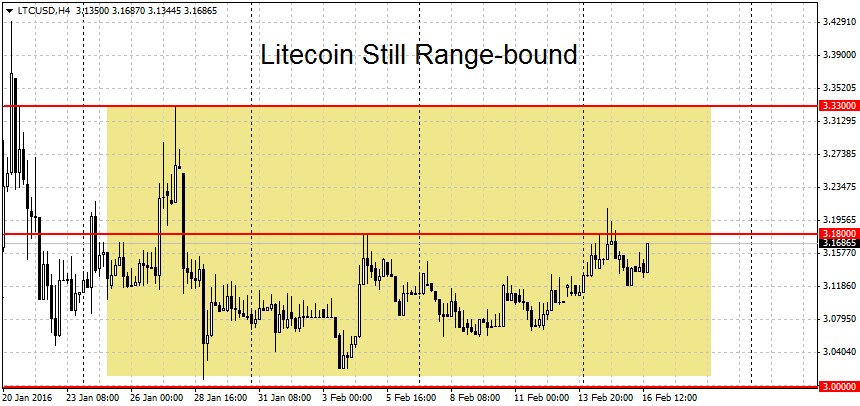
To end the current range and join the BTC uptrend, the bulls will have to break the $3.33 swing high. A decisive break above here could open the door toward the $3.43 swing high. More resistance on the way up can be found at $3.50, $3.65 and $3.82 dollars per coin.
On the lower end, strong support can be found near the $3 dollars round figure. A decisive break of this support area would technically start a new LTC downtrend. But close to here we have another strong support area in the form of a triple bottom formation around $2.88-$2.89 dollars per coin. A clean breakdown below these levels could see more losses for Litecoin towards $2.70 and $2.50 dollars.
FXOpen offers the world's most popular cryptocurrency CFDs*, including Bitcoin and Ethereum. Floating spreads, 1:2 leverage — at your service (additional fees may apply). Open your trading account now or learn more about crypto CFD trading with FXOpen.
*Important: At FXOpen UK, Cryptocurrency trading via CFDs is only available to our Professional clients. They are not available for trading by Retail clients. To find out more information about how this may affect you, please get in touch with our team.
This article represents the opinion of the Companies operating under the FXOpen brand only. It is not to be construed as an offer, solicitation, or recommendation with respect to products and services provided by the Companies operating under the FXOpen brand, nor is it to be considered financial advice.
Stay ahead of the market!
Subscribe now to our mailing list and receive the latest market news and insights delivered directly to your inbox.


Latest articles

Weekly Market Insights with Gary Thomson: The Week of Central Banks and Earnings
In this video, we’ll explore the key economic events and market trends, shaping the financial landscape. Get ready for insights into financial markets to help you navigate the week ahead. Let’s dive in!
In this episode of Market

Intel at a Crossroads: Earnings Beat Meets Technical Resistance
Intel has just delivered its strongest quarter in over fifteen years, and the market reaction says it all. Q2 2026 revenue surged 25% year-over-year to $16.1 billion, crushing the consensus estimate of $14.42 billion, while adjusted EPS of

Tesla: Complex Range Structure Breaks Down Following Quarterly Earnings
Tesla released its Q2 2026 results after the market closed on 22 July. Revenue increased 26% year-on-year to $28.24 billion, while vehicle deliveries reached a record 480,126 units. However, operating margin fell sharply to 1.4%, down from