


Bitcoin Hits New September Lows, Namecoin Hovers Above Parity
FXOpen
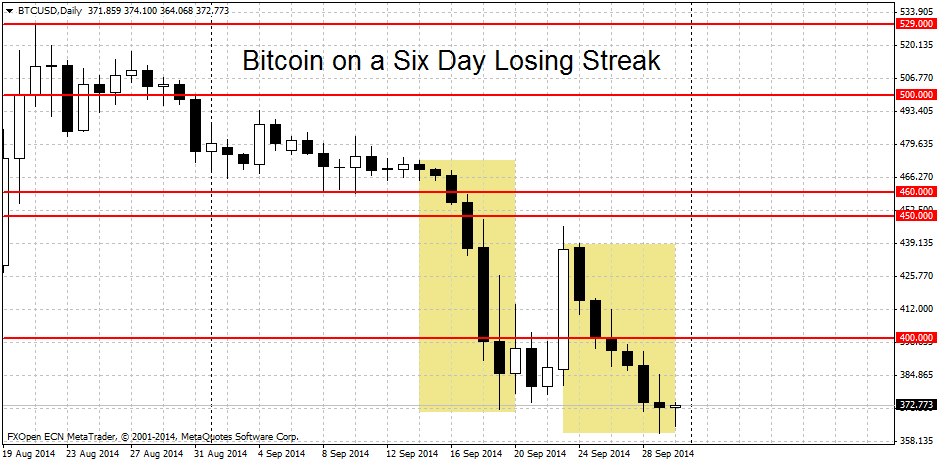
Bitcoin hit new lows for the month of September yesterday. Prices traded to a daily low of $361.12 before rebounding somewhat. Everyone’s favorite virtual currency is now on a six day losing streak, matching the negative streak that ended just 10 days ago on September 20th. Buying one bitcoin will currently set you back only $372 dollars, a far cry from the $726 dollars on January 1st of this year.
What’s Behind the Bitcoin Selloff?
There have been two main theories about the selloff in BTC prices this year.
1. The first theory is a simple story of supply and demand. Bitcoins are created by a process called mining. Mining produces a constant supply of bitcoins, around 25 BTC every 10 minutes. This comes to 3600 bitcoins per day, around $1.34 million at a price of $372. In the past year there has been a constant ”arms race” in bitcoin mining. This drove the profits in the industry down to near electricity costs thus now bitcoin miners are ”forced” to sell their newly mined BTC right away to cover their power bills.
2. This year saw a massive influx of new merchants accepting bitcoin. The process that started with major US retailer Overstock last year continued with TV network DISH and Dell Computers. Major non-profits like Wikipedia and United Way started to accept BTC donations. All of this opened new avenues to spend your bitcoins but there has been no corresponding jump in consumer interest.
In addition, increasing regulation around the world made it harder, not easier, to buy bitcoins. Earlier this year China effectively shutout bitcoin exchanges from its financial system. In the States, the New York Department of Financial Services plans to impose a new regulatory structure for cryptocurrencies. And in Europe, the European Banking Authority warned banks to stay out of bitcoin until new rules to govern the sector are drawn up.
Namecoin Hovers Above Parity
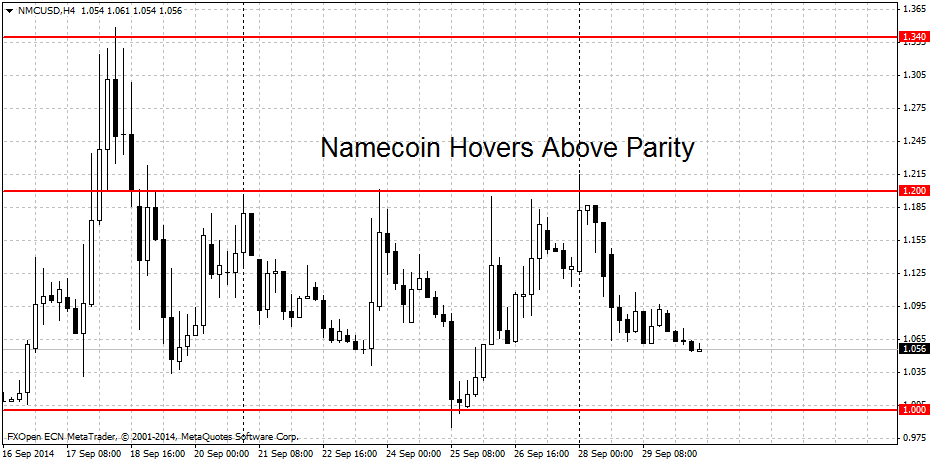
Namecoin prices have been moving in quite a large range of 20% for the past 10 days. The high of this congestion area can be pinned at $1.20 and the low is at the $1 parity level. Prices are currently trading just above this figure at $1.056. A breakout above $1.20 or below $1 may lead to prolonged gains/losses in the cryptocurrency. But keep in mind that trading near these figures is messy. Few days ago prices got as high as $1.215 before going down back below $1.20. Similarly on September 25th NMC/USD sold off to a low of $0.985 before rebounding above parity. Think of these levels as areas, not as strict breakout points.
Trade over 50 forex markets 24 hours a day with FXOpen. Take advantage of low commissions, deep liquidity, and spreads from 0.0 pips (additional fees may apply). Open your FXOpen account now or learn more about trading forex with FXOpen.
This article represents the opinion of the Companies operating under the FXOpen brand only. It is not to be construed as an offer, solicitation, or recommendation with respect to products and services provided by the Companies operating under the FXOpen brand, nor is it to be considered financial advice.
Stay ahead of the market!
Subscribe now to our mailing list and receive the latest market news and insights delivered directly to your inbox.


Latest articles

Amazon Earnings: Does the Chart Already Know Something the Numbers Don't?
All eyes are on July 30, when Amazon reports Q2 2026 earnings, with Wall Street increasingly convinced the bar has been set too low. Consensus sees EPS near $1.82-$2.26 on roughly $197 billion in revenue, but the

WTI Analysis: Gap Breaks Short-Term Trend as Price Remains Trapped Between the POC and Profile Boundary
WTI crude oil plunged by more than 7% on 27 July 2026 after the US suspended a series of strikes against Iran over the weekend, raising hopes of a diplomatic solution and the reopening of shipping through the Strait of

US Dollar Index: A Defining Week for the King of the Markets
The dollar heads into a pivotal week trading near 101.80, just off a 15-month high, with the Fed's July 29 meeting standing as the clear focal point. Markets currently price roughly a 65% chance of a hold, though renewed