


Bitcoin Hits Two-Year High
FXOpen
Everyone’s favorite cryptocurrency hit a two-year high yesterday at $689.99 per coin. Litecoin continues to follow BTC higher, up close to 5 percent since last Tuesday.
Bitcoin Surges to Two-Year High
After consolidating for eight days Bitcoin surged to two-year highs yesterday. The prices peaked at $689.99 on FXOpen before falling back to $674 right now. On other exchanges we saw the highs of over $700 per coin. In our previous article HERE we went over the price differences between the major BTC exchanges.
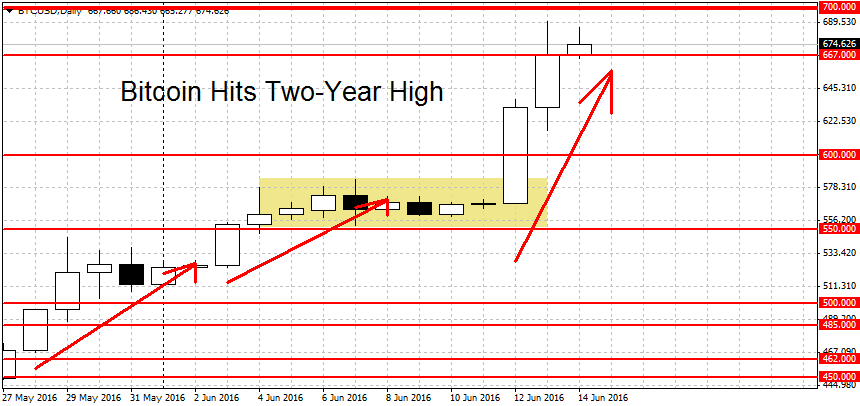
The gains have been massive since the initial breakout around $462-$465 per coin. Bitcoin is up by over 45 percent since that point. But the trends can persist far longer than we think it is possible to. So until the market proves us wrong by reversing course, the uptrend is intact. Furthermore, the trend is up on all the three of the time-frames we follow: daily, weekly and monthly.
The first resistance above the current prices stands in the $698-$700 area, followed by $720. A breakout above here could intensify the gains. We have more levels to the upside at $750 and $800 followed by a cluster of weaker levels at $830, $840 and $850 per coin. The round figures at $900 and especially near $1000 will be important as well.
On the downside, a support can be found at $667 followed by a weaker level at $650 and the round figure at $600 per coin. A breakdown below here would be a cause for worry. But the short-term rally will remain intact until the bears break $550 as well.
Litecoin Gains 5 Percent
Alternative cryptocurrency Litecoin continues to march to Bitcoin’s drum. The crypto is up by almost 5 percent since last Tuesday, currently quoted at $5.08 per coin. On the chart below we can see an uninterrupted trend higher. After a brief pause last week LTC is back on the move.
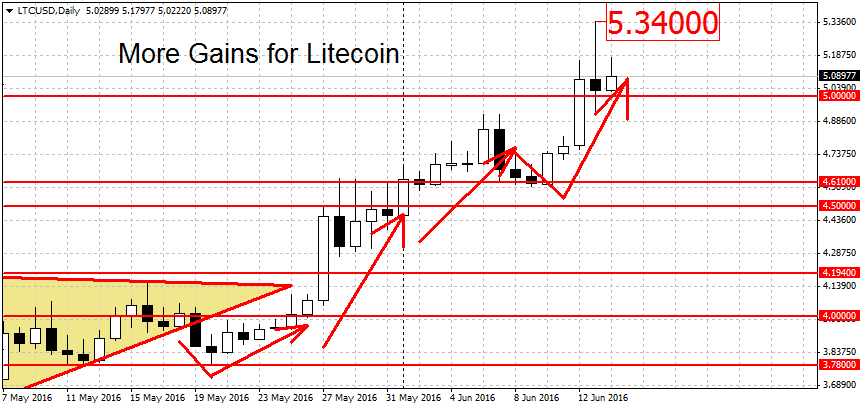
The first potential resistance is at yesterday’s high of $5.34. From here up to last year’s high at $8.64 there are no former levels to speak of. However, due to a large gap between the current price and $8.64, some resistance levels are likely to emerge in between. Potential candidates include the round figures at $6, $7 and $8 per coin, as well as the 50 cents figures at $6.50 and $7.50.
On the downside, we find a support at the round $5 level, followed by a support area from $4.59 to $4.61 per coin. A decisive break of this support area would end the short-term LTC`s uptrend. The medium-term trend for Litecoin is up as well while the long-term trend is still undecided.
FXOpen offers the world's most popular cryptocurrency CFDs*, including Bitcoin and Ethereum. Floating spreads, 1:2 leverage — at your service (additional fees may apply). Open your trading account now or learn more about crypto CFD trading with FXOpen.
*Important: At FXOpen UK, Cryptocurrency trading via CFDs is only available to our Professional clients. They are not available for trading by Retail clients. To find out more information about how this may affect you, please get in touch with our team.
This article represents the opinion of the Companies operating under the FXOpen brand only. It is not to be construed as an offer, solicitation, or recommendation with respect to products and services provided by the Companies operating under the FXOpen brand, nor is it to be considered financial advice.
Stay ahead of the market!
Subscribe now to our mailing list and receive the latest market news and insights delivered directly to your inbox.


Latest articles

DAX 40: consolidation amid technology sell-off
A wave of selling in the technology sector that emerged earlier this week has weighed on European equities. The trigger was investor concern over the profitability of large-scale debt-funded investments by major US tech companies in AI infrastructure. The Nasdaq

Euro Hits Fresh Yearly Lows Amid Dovish ECB Signals
The euro remains under pressure following weak macroeconomic data from the euro area and fresh signals that the European Central Bank is prepared to maintain a more accommodative monetary policy stance. Data released yesterday pointed to a deterioration in business

Pound at Key Levels: Markets Assess Impact of Political Uncertainty in the UK
The British pound remains under pressure following increased political uncertainty in the United Kingdom triggered by the Prime Minister’s resignation. Investors are assessing potential shifts in the political and economic policy outlook after the head of government stepped down,