Both BTC/USD and XRP/USD Under Selling Pressure
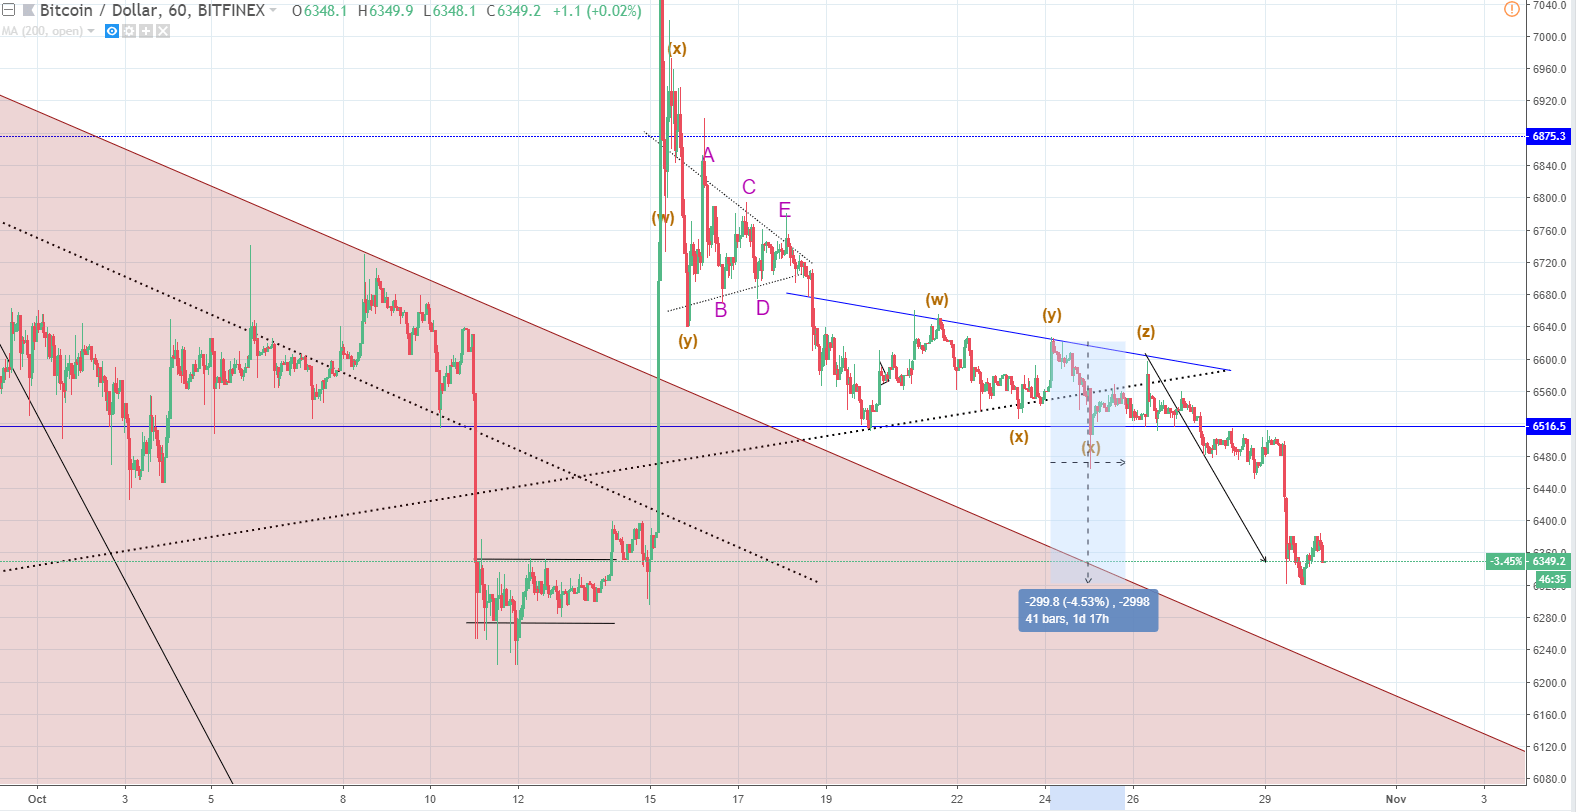
Last week the price of Bitcoin has been hovering around $6556 levels before the price dropped. From last week’s high at $6624 the price decreased by 4.53% to its lowest point today at $6320.
Looking at the hourly chart you can see that the price is on the exact levels of the projection made on 24 October. WXY waves have been counted and as the price action formed a triangle, which points out consolidation, it has been projected that two more waves would appear, and as the wave Z ends on the triangle’s resistance line, a move to the downside would occur. The target for the end of the down move was the resistance level from the prior minor range from which the October 15th spike was made.
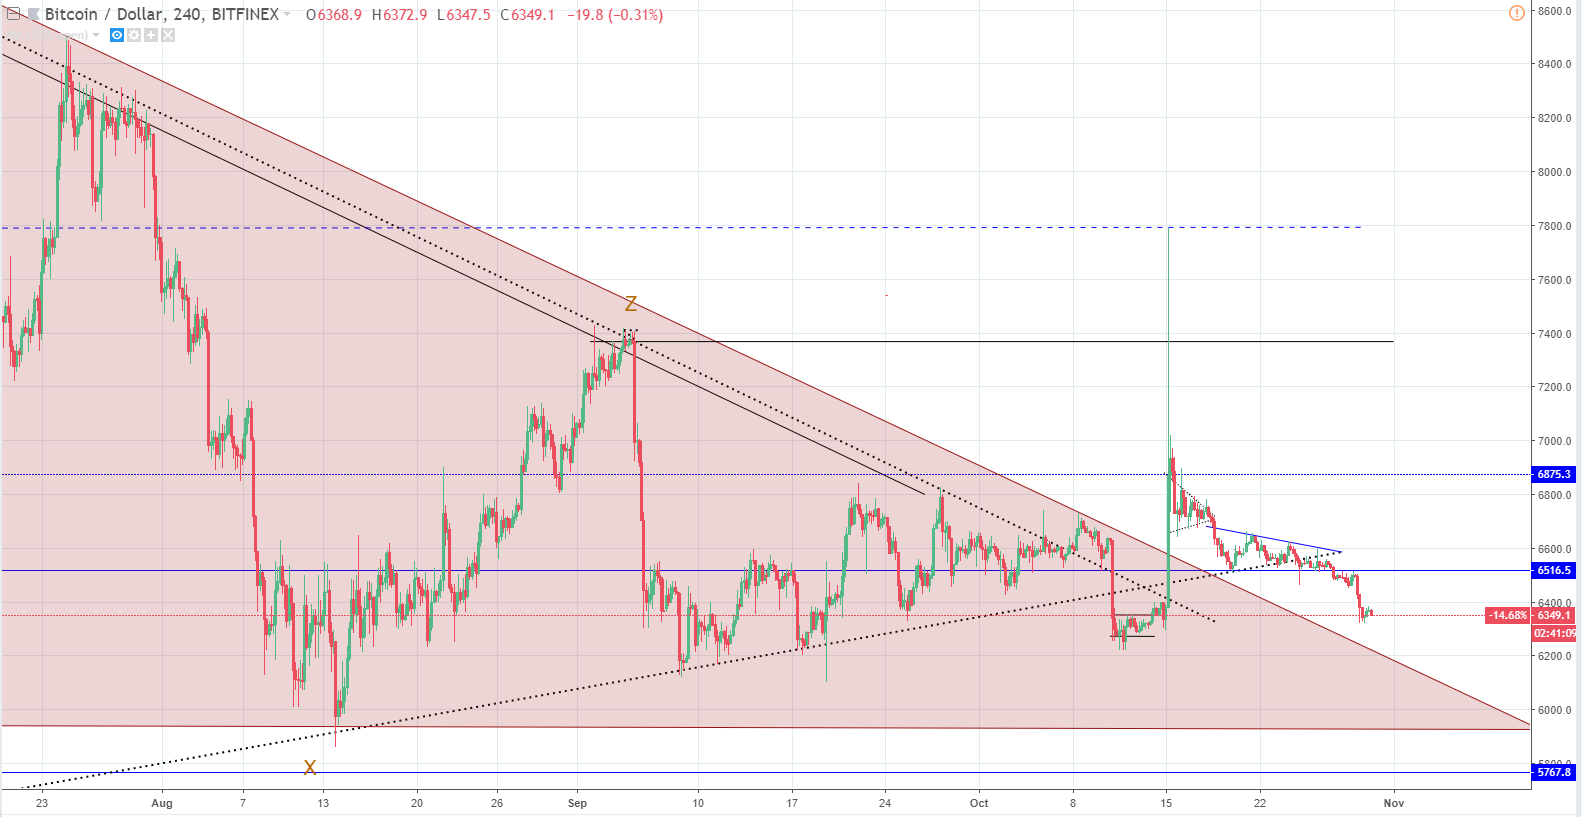
Horizontal support level at $6516 was broken and the price is heading for the resistance line of the descending triangle seen on the 4-hour chart below, which was pointed as a likely scenario in the last week’s analysis.
After the price broke out from the descending triangle with a massive spike many traders were speculating of a potential bull run starting, but considering the fundamental reason behind it, which is the Tether FUD, it seems that all of those gains will be wiped out sooner or later because the demand wasn’t real. Sellers got a better price basically and the selling was activated. It may cause an avalanche of selling, especially when the price goes below some of the significant levels.
Looking at the price action in the last couple of days we can see that the momentum behind the selloff is strong. Unlike the last time, the price action fell steeply now there are no same length green candles to make for the loss as quickly indicating that the price will bounce. From the low at $6344, only three green candles appeared before this current red one. The first one out of those is a doji and second two have wicks from the upside indicating selling pressure.
From here we would be expecting more downside and an interaction with the descending triangle leading up to the full retracement back to its support level or at least inside the territory around the $6111 level.
XRP/USD
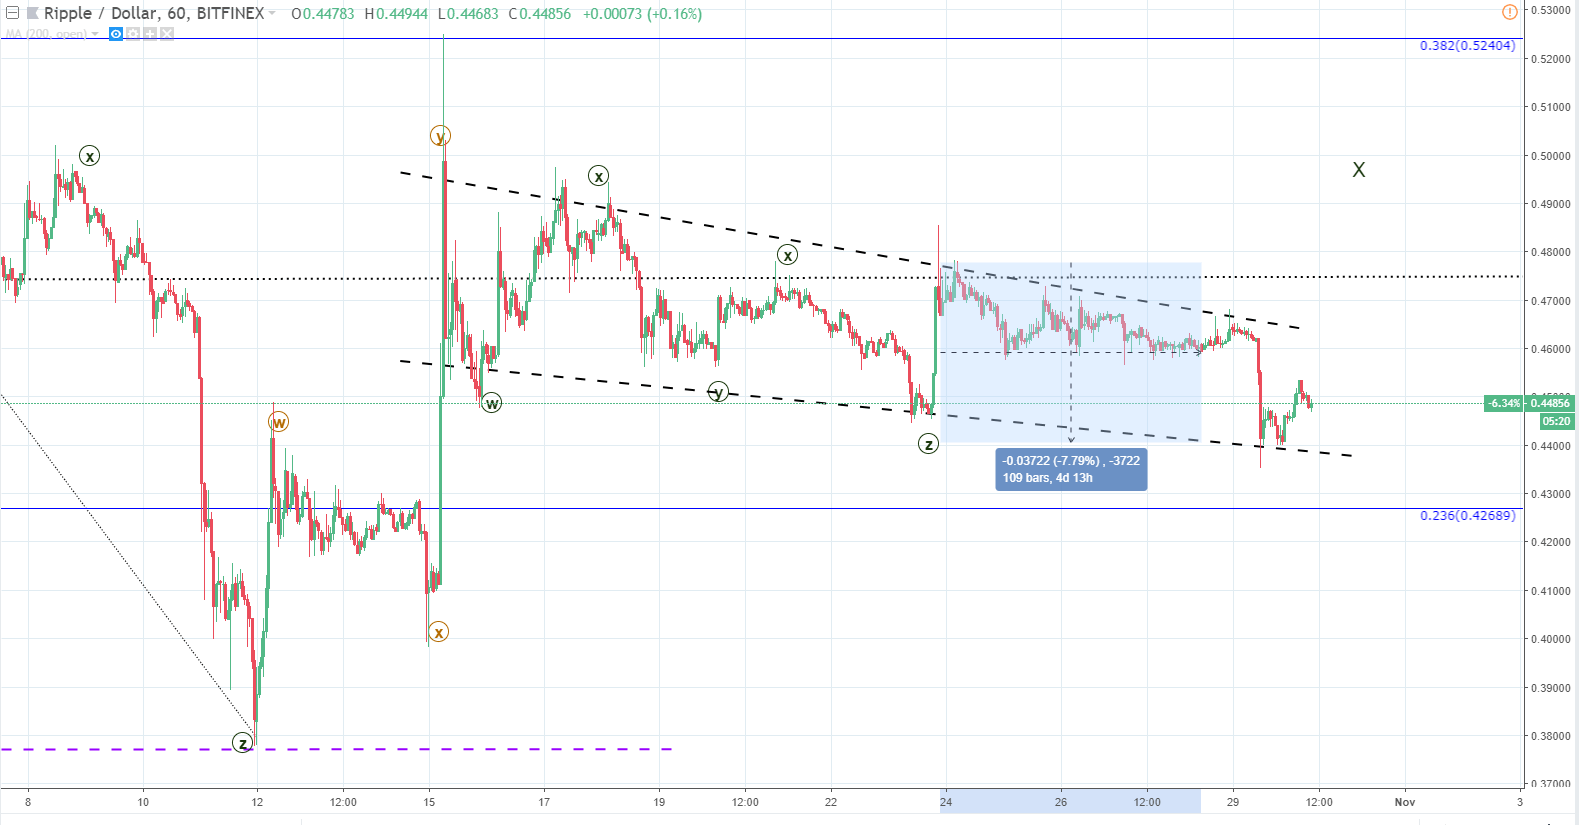
From last weeks high at $0.47778 the price of Ripple has fallen by 7.79% to its lowest point yesterday at $0.44.
Looking at the hourly chart we can see that the price action has found support on the descending channel in which the price is undergoing a correction after the last Monday’s spike to $0.4998. As you can see the correction labeled as a WXYXZ and the current structure hasn’t been labeled for now because I was expecting another WXY to the upside but the channel has been prolonged by two more waves.
Unlike in the case with Bitcoin, the price of Ripple still hasn’t lost all of the gains made by the last Mondays spike and the price is still above the 0.236 Fibonacci retracement level. However, the minor support has been broken and a cluster appeared around the channel support line. It resulted in a fast bounce back above the mentioned minor support level, which is currently retesting the support around $0.4483.
If the support holds I would expect another interaction with the channel resistance level, if it does not we would expect a breakout from the channel on the downside and a steep downfall below the 0.236 Fibonacci level.
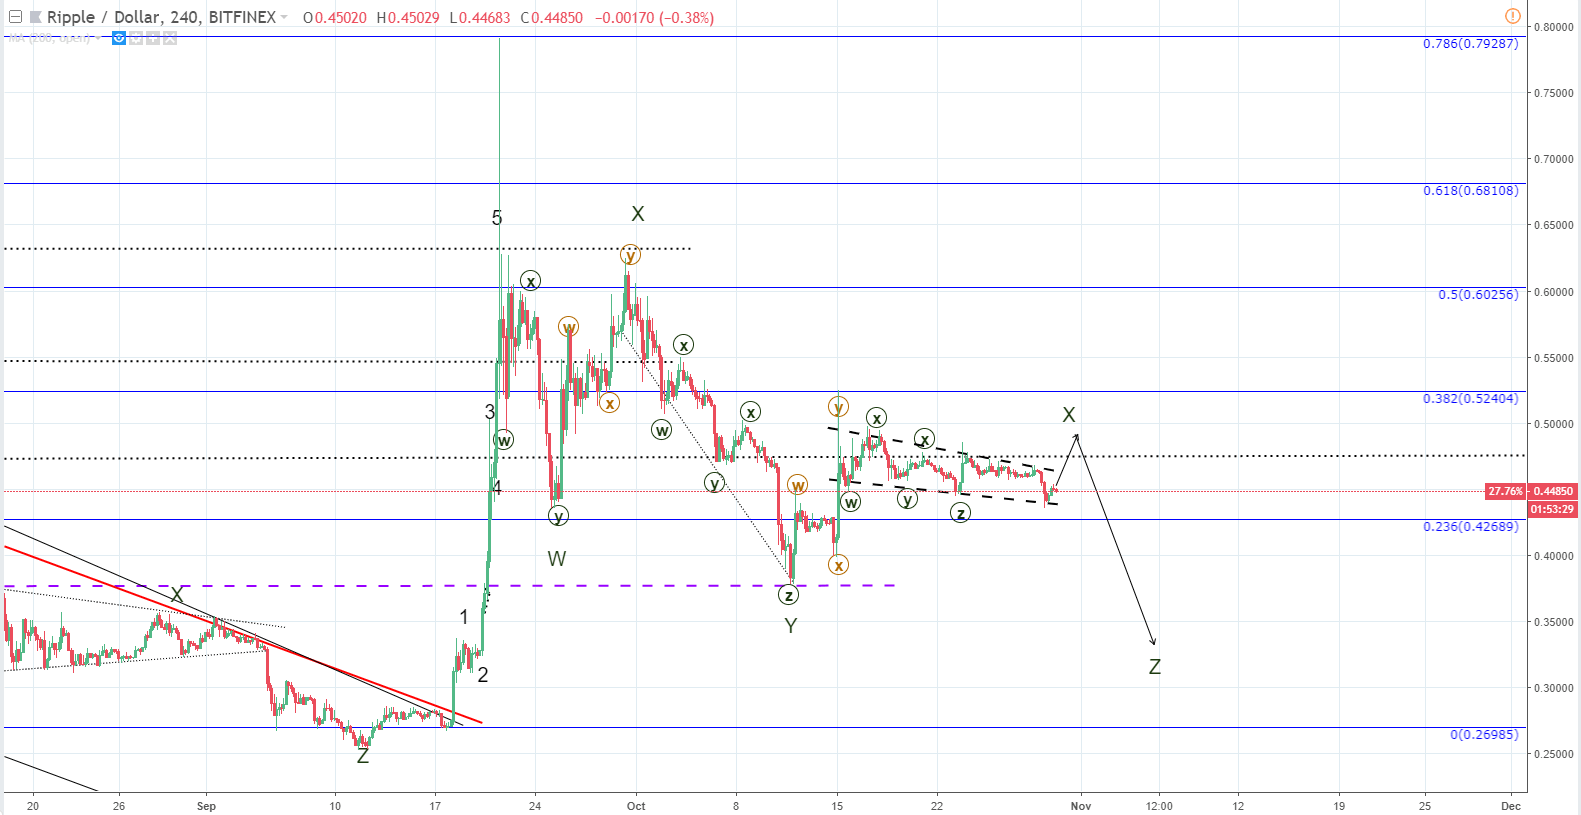
Zooming out on the 4 hour chart you can see the Elliott Wave count clearly. It has been projected that the correction from 21th of September when the price reached up to the 0.786 Fibonacci level, would end up being a minor WXYXZ that will lead up to the price getting back to around 75% of the increase made in September.
As you can see the price can go up at first according to this count, which is unlikely but wouldn’t make the count invalid. The projected target would be around wave 1 ending of the prior impulsive wave around $0.331.