


How to Apply the Elliott Wave Method in Trading
FXOpen

There are many ways to trade in the financial markets. The more tools you have in your trading arsenal, the more opportunities you may gain. Indicators like moving averages, MACD, RSI, and Stochastics interpret the data from the points the price has already been and point out the current market conditions. Elliott Wave theory, however, is used differently. It outlines future price movements and their pathway, building upon the current context.
This FXOpen article will inform you about some of the theoretical fundamentals and describe how to utilise corrective waves to find good trading opportunities.
What Is the Elliott Wave Theory?
The Elliott Wave theory is a method of technical analysis that was developed by Ralph Nelson Elliott in the late 1930s. It’s based on the idea that financial markets, like other natural systems, move in repetitive cycles — waves made up of price patterns used to predict future price movement.
The price advances in a five-wave manner and retraces in a three-wave manner, making one cycle.
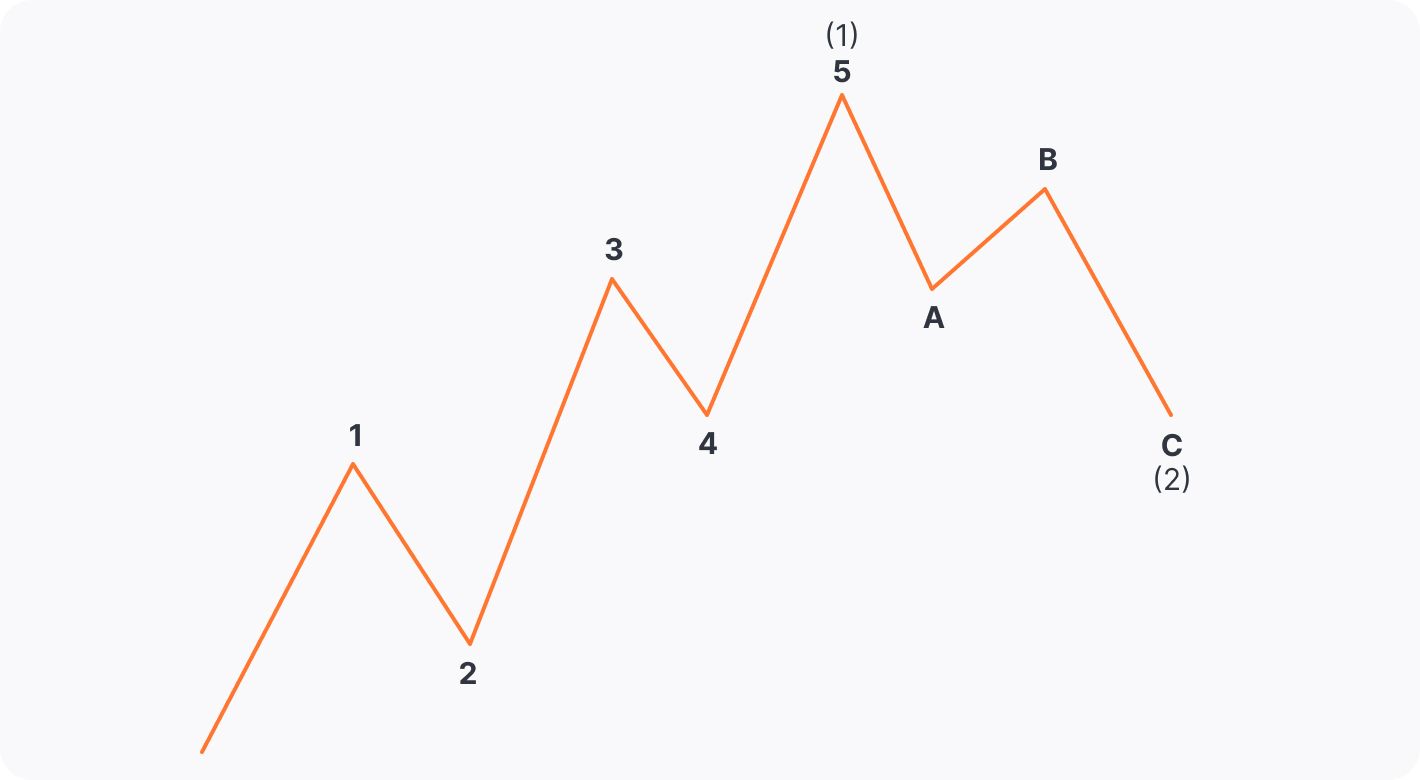
Why is that? Being efficient but also inert in nature, the minimum amount of movement needed for advancement is a five-wave setup. If it were less than that, we wouldn’t see a trend forming. On the other hand, a three-wave setup is a minimum movement for the price to form a trend - two lows and two highs. However, it is only possible to get a clear trend by combining these two movements.
An important aspect of trading using the theory is learning how to draw Elliott waves, so traders can determine corrective wave patterns and make more informed trading decisions. The wave theory is used in stock, commodity, cryptocurrency*, and Forex trading.
Understanding the Elliott Wave Theory
The basics of this technique are motive and corrective waves. Motive waves are those that move in the primary direction of the trend, while corrective formations are those that move within the counter-trend.
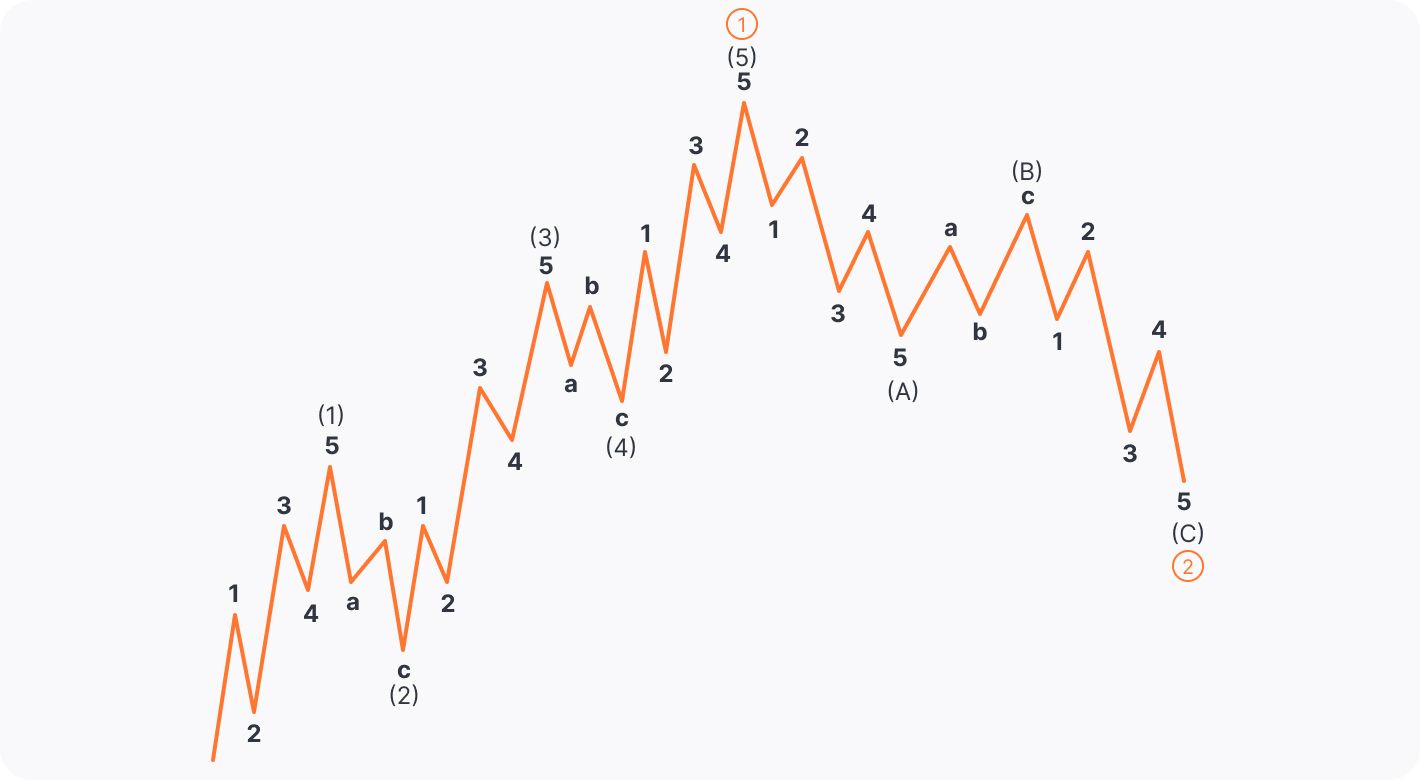
Another important pillar of the Elliott method is market fractality. In other words, waves may be found in any timeframe and are labelled in different degrees. For example, a motive wave is a five-wave formation that consists of impulse waves 1, 3, and 5, while waves 2 and 4 are corrective. These degrees are the way to label the waves in different timeframes and define their position within the overall progress of the market. There are 9 degrees, from Grand Super Cycle on the weekly and monthly timeframes, to Subminuette found on the minute periods.
One of the key aspects of this method is understanding Elliott wave cycles. These cycles help traders determine key levels of support and resistance, and can also help determine when a price is likely to make a significant move.
While impulse waves are labelled with numbers 1, 2, 3, 4, and 5, corrective ones are labelled with the letters ABC, ABCDE, WXY, and WXYXZ. We will discuss them in more detail in the following paragraphs and describe how to use them to find trading opportunities.
How Elliott Waves Work
As stated above, there are many rules and guidelines for properly applying this method. Our primary job is to count the waves according to these rules and understand that a set of combinations exists to make valid projections.
Impulse wave
An impulse wave is primary in the trend and can be found in waves 1, 3, and 5 of the motive wave of the higher degree count.
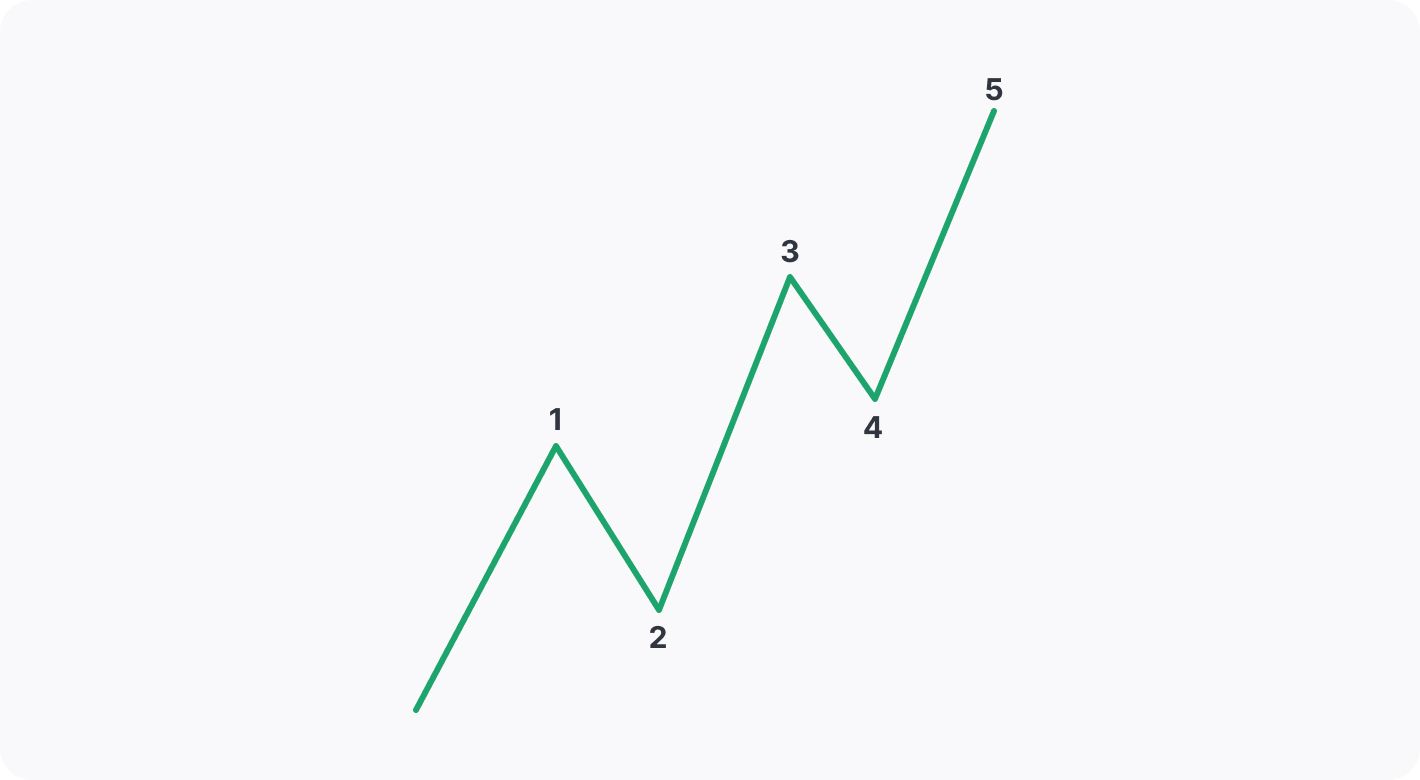
There are three main rules that need to be applied to determine the impulse wave:
1. Wave 2 shouldn’t go below the starting point of wave 1
2. Wave 3 shouldn’t be the shortest among waves 1, 3, and 5
3. Wave 4 shouldn’t enter the price territory of wave 1
We use Fibonacci tools to measure the distance between the waves - retracement for corrective waves and extension for the impulse wave targets. There are some optimum Fibonacci levels that are usually used.
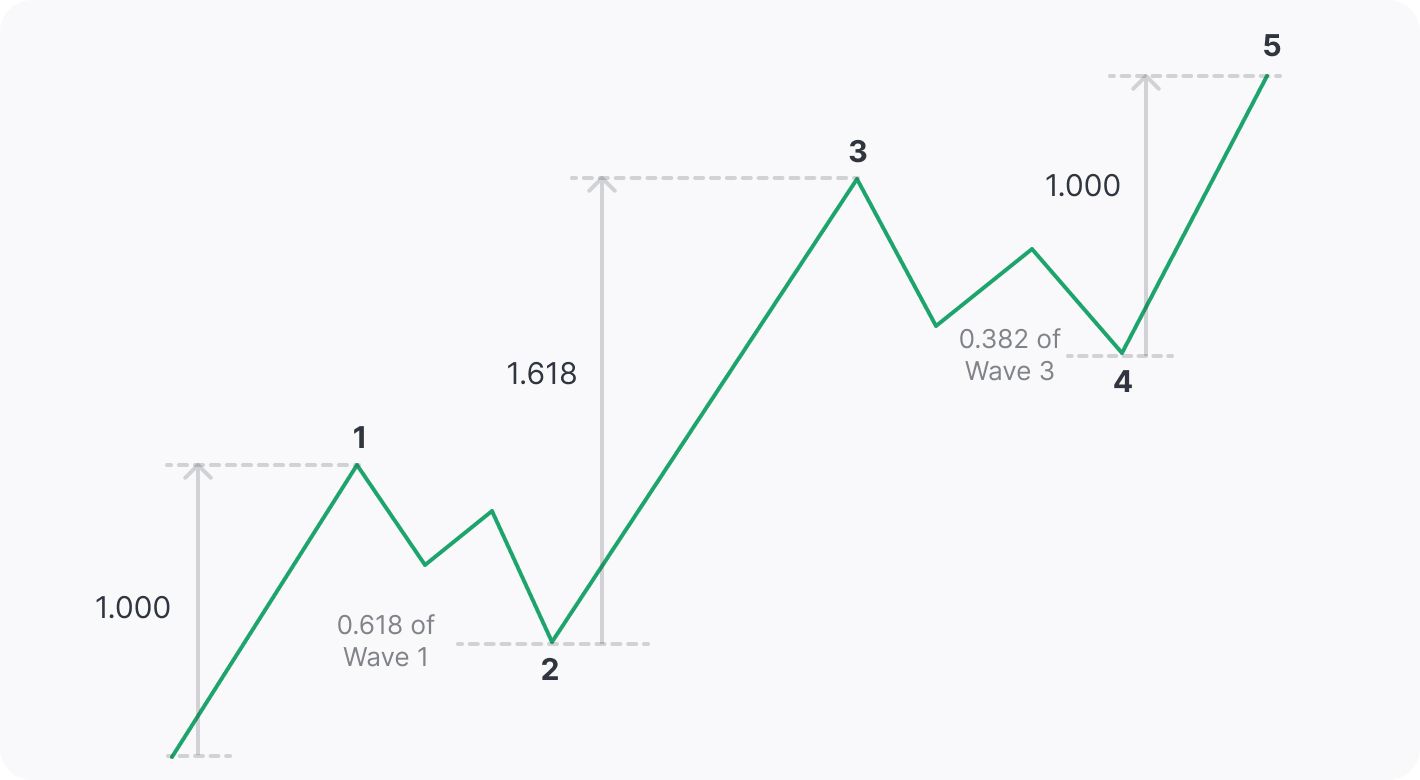
For example, wave 2 usually retraces to around 0.618 of wave 1. Wave 3 comes to the 1.618 Fibonacci extension of wave 1. Wave 4 is usually a sideways Elliott correction wave and a shallow one, only retracing back to around the 0.382 Fibonacci retracement level of wave 3.
Note: If wave 3 is the longest, waves 1 and 5 are usually the same length.
Corrective Waves
Corrective waves are important because they may help traders identify potential levels of support and resistance. For example, if there is an uptrend, a trader may look for them to form setups such as a flat, zigzag, or triangle.
When it comes to identifying such waves, the most important thing to keep in mind is that the patterns are not always clear-cut and may not always align perfectly. In these cases, it's important to use other technical analysis tools to make a trade decision.
Corrective wave types
There are three main types of corrective waves, each with its own subcategories. Their structure and place in the market makes them predictable.
The ABC correction is called a ZigZag and is an aggressive correction seen in wave 2 of the motive wave. It consists of 5, 3, and 5 moves, meaning wave A is a five-wave formation, wave B is a corrective ABC of a lower degree, and wave C is another five-wave impulse.
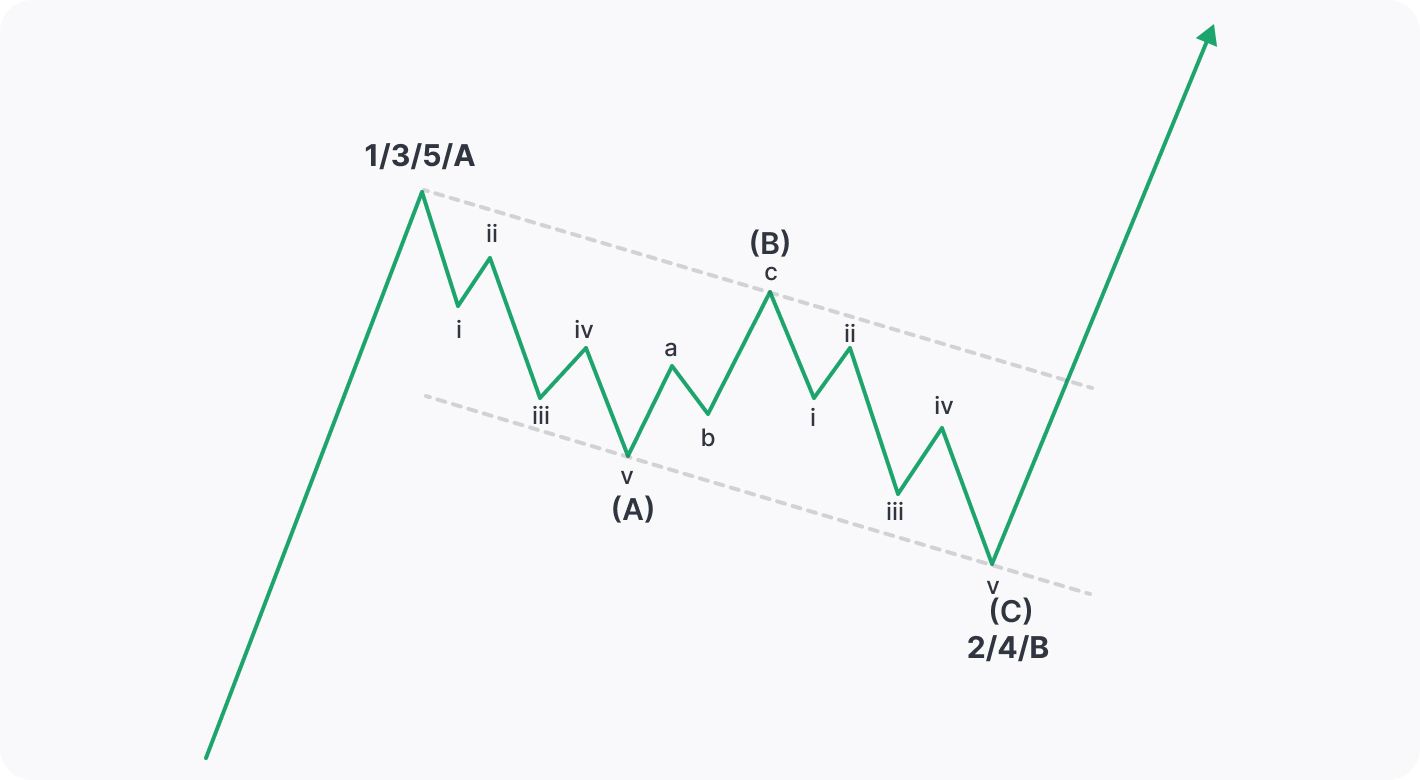
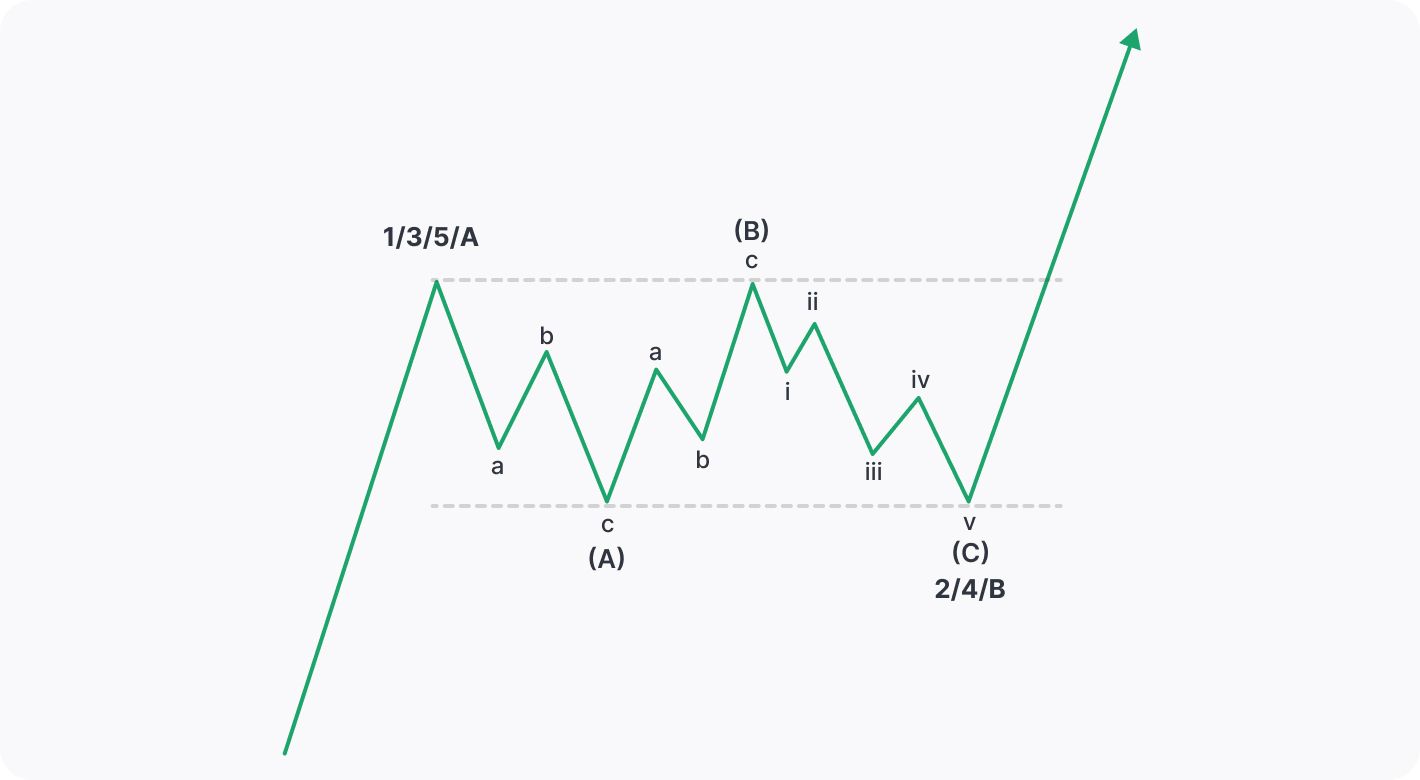
ABC correction can also be called a Flat correction, with its variations - running Flat, expanding Flat and irregular Flat. These corrections appear in wave 4 of the motive wave and what distinguishes them from a ZigZag is the relation between waves A and C. Additionally, in a Flat correction, wave A is a three-wave move, making the correction a 3-3-5. They are not as aggressive and usually form sideways movements or slightly upward structures.
Finally, we have a triangle, a five-wave setup, labelled ABCDE, whose waves are subdivided into three-wave formations – 3-3-3-3-3.
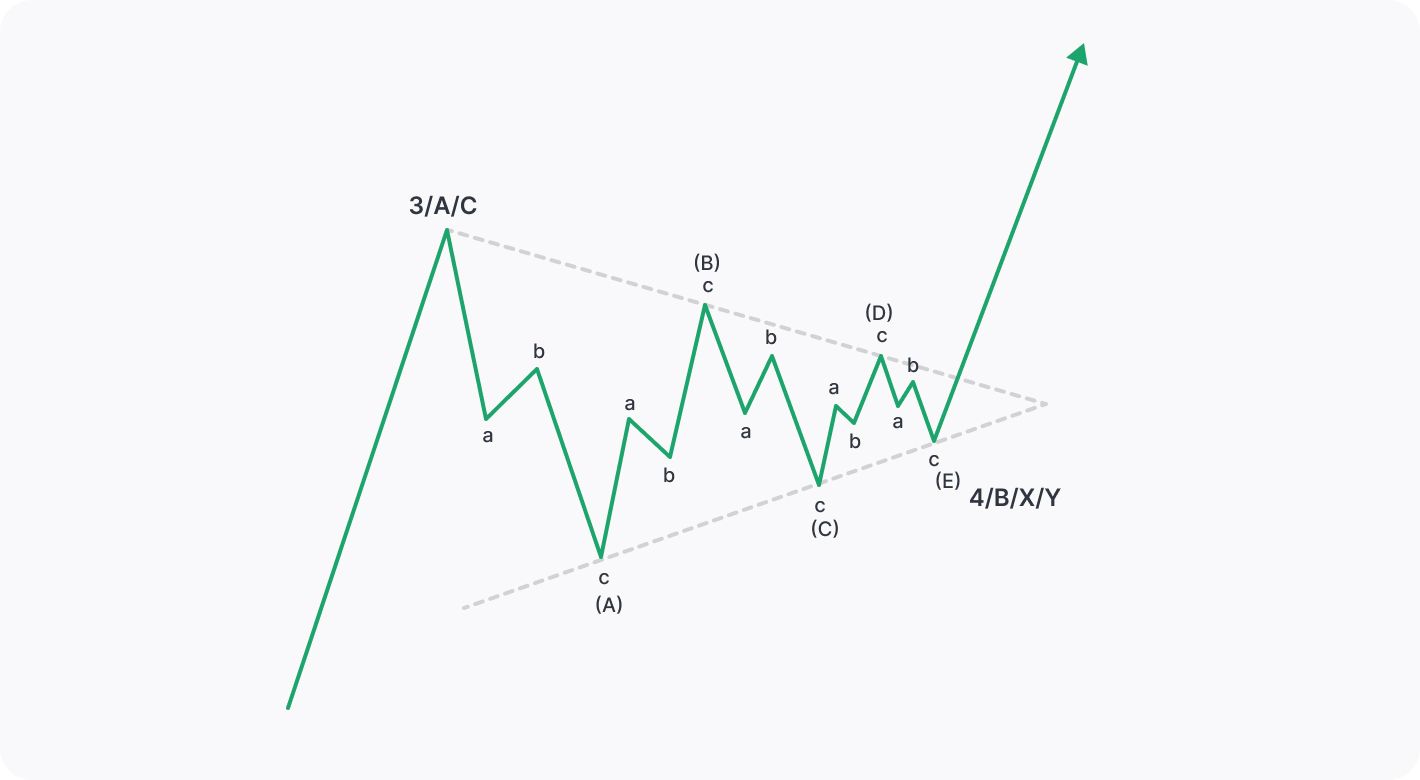
The triangle usually comes as wave 4 but can also be found in corrective wave B of an ABC correction. Depending on the relationship between its support and resistance levels, they can be symmetrical, descending, or ascending. They can also be expanding or contracting if the sub-waves get bigger or smaller as the price approaches the triangle’s apex.
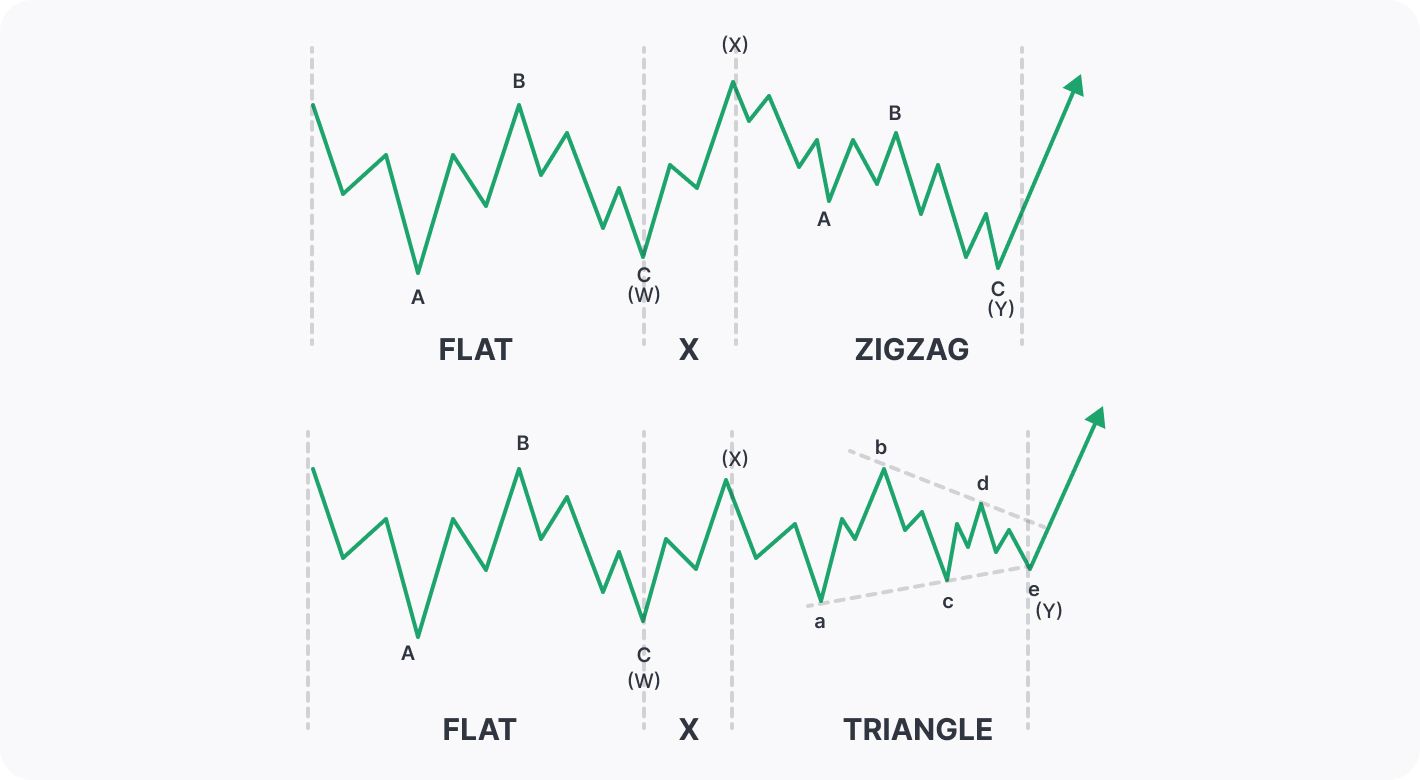
The last type of corrections are complex corrections labelled double three (WXY) and triple three (WXYXZ). These corrections are a prolonged sideways range, choppy with a lot of spikes and wicks, again usually found in wave 4. They are composed of all of the previously mentioned corrections and their combinations.
How Do You Trade Using Elliott Wave Theory?
Trading using the Elliott Wave indicator is all about identifying the current trend and the relative position of the price within it. Once you have identified the trend, you can identify the specific type of a corrective formation.
When using this method in forex trading, it's also important to keep in mind that it’s not a standalone system. The theory suggests traders use it in conjunction with other technical analysis tools and indicators, as well as fundamental analysis.
Live Example
Now let's apply these rules and guidelines to a live chart using our charting platform TickTrader and see how we can develop an Elliott wave strategy.
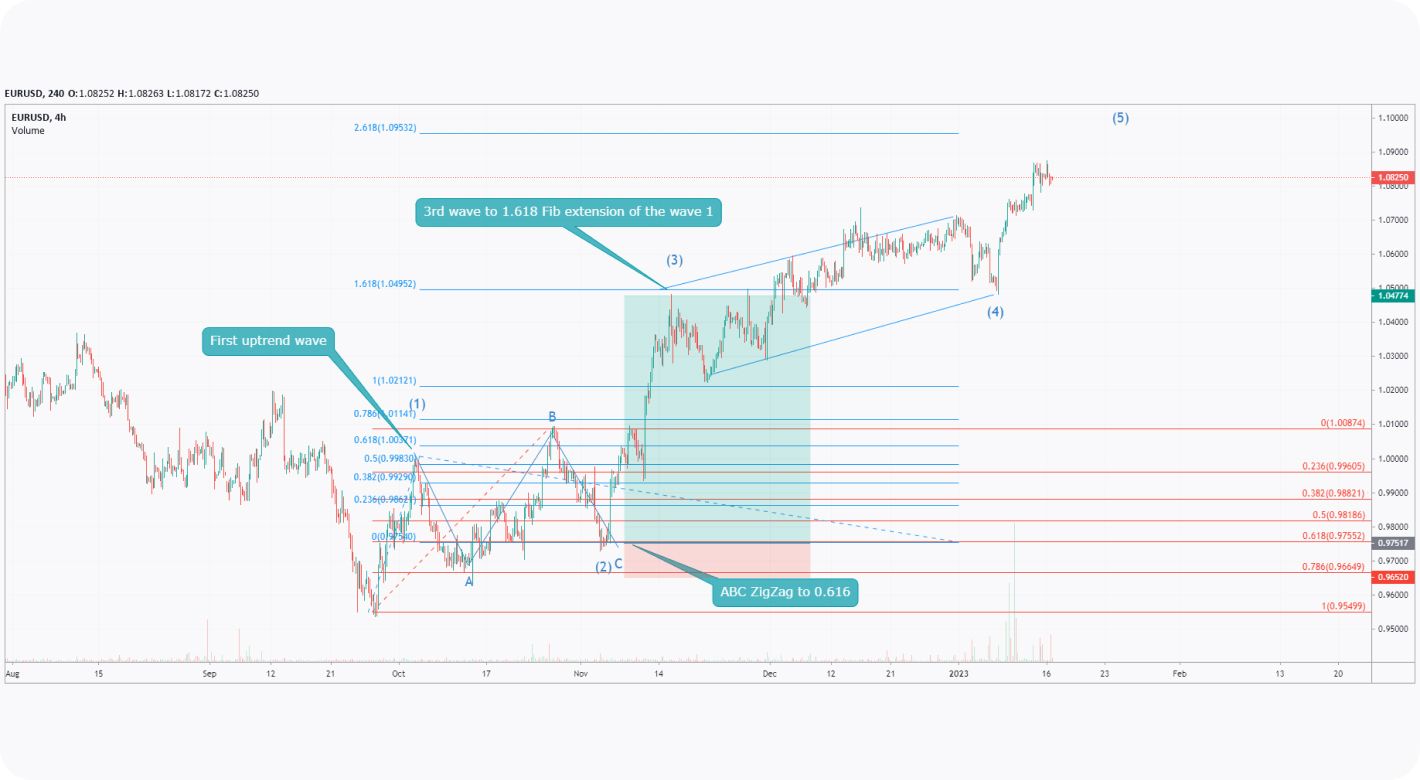
On the H4 EURUSD chart, there is an opportunity for a long position. From September 28th to October 5th, 2022, we have seen the 1st wave to the upside. As there was a downtrend prior, we could wait for it to play out as a corrective move.
An ABC ZigZag correction occurred from the 5th of October to the 3rd of November, returning to the typical point of the 0.618 Fibonacci retracement. Projecting the price target for a potential 3rd wave at the 1.618 Fibonacci extension, we could have come up with a long position of 7.28 risk/reward ratio.
Our entry would be at the 0.618 Fibonacci level at 0.975, our stop-loss level is set on the prior low level, just below the 0.782 Fibonacci retracement at 0.965, and our target is set at 1.618 Fibonacci extension at 1.049.
In this example, we would wait for corrective wave 2 to play out and confirm the start of an uptrend, thus buying on the strongest move, which is usually wave 3.
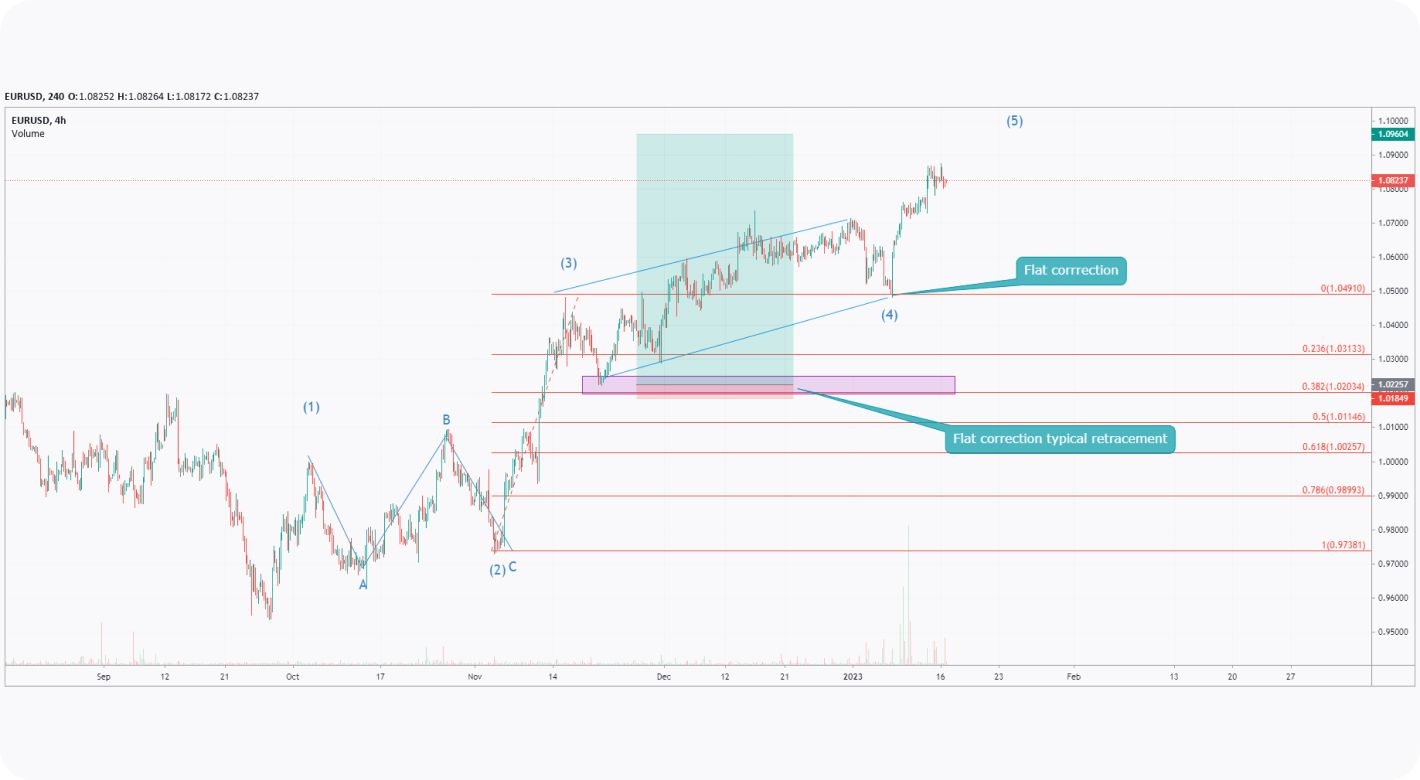
In addition, after the price reached our target for the 3rd wave, anticipating a Flat correction to the 0.382 Fibonacci retracement of the 3rd wave length, we would stay in the same position, but raise our stop-loss level around 1.02 as well as our target to catch the ending wave 5.
It's also important to keep in mind that Elliott Waves aren’t a perfect system and will not always produce accurate signals. In these cases, traders need to be prepared to adjust their trades and take any necessary losses.
Summary
The Elliott Wave Theory is a powerful method of technical analysis used to predict future market behaviour. By understanding it and learning how to identify and trade Elliott wave patterns, traders may gain an edge in the market.
However, this method is complex and requires a lot of practice and experience to be used effectively since there are many corrective setups and combinations. In order to learn, you can start to apply it using a demo account.
Traders use this technique in conjunction with other technical analysis tools and indicators and always keep in mind that it isn’t always perfect and may produce inaccurate predictions. Once you have learned and practised it, trading on a live account may give you an edge and provide you with a thorough understanding of the market context.
*At FXOpen UK, Cryptocurrency CFDs are only available for trading by those clients categorised as Professional clients under FCA Rules. They are not available for trading by Retail clients.
This article represents the opinion of the Companies operating under the FXOpen brand only. It is not to be construed as an offer, solicitation, or recommendation with respect to products and services provided by the Companies operating under the FXOpen brand, nor is it to be considered financial advice.
Stay ahead of the market!
Subscribe now to our mailing list and receive the latest market news and insights delivered directly to your inbox.


Latest articles

Nasdaq 100: 48 Hours of Chaos, One Trendline Standing in the Way
Wall Street just lived through one of its wildest 48 hours of the year. On Wednesday, the Fed held rates steady at 3.50%-3.75%, but three FOMC members broke ranks to demand a hike—an unusually hawkish dissent

Amazon Analysis: Strong Earnings Coincide with a Breakout from the Correction
On 30 July, Amazon.com reported its financial results for the second quarter of 2026, significantly exceeding market expectations. Revenue rose 20% year-on-year to $200.6 billion, compared with the consensus forecast of around $196.5 billion. The main growth

GBP/USD and EUR/GBP Await Key Bank of England Decision
The pound strengthened following the outcome of the US Federal Reserve meeting, where the central bank, as expected, kept interest rates unchanged. However, the Fed did not provide the market with clear signals of an imminent shift towards rate cuts,