BTC and XRP - Correction likely started
BTC/USD
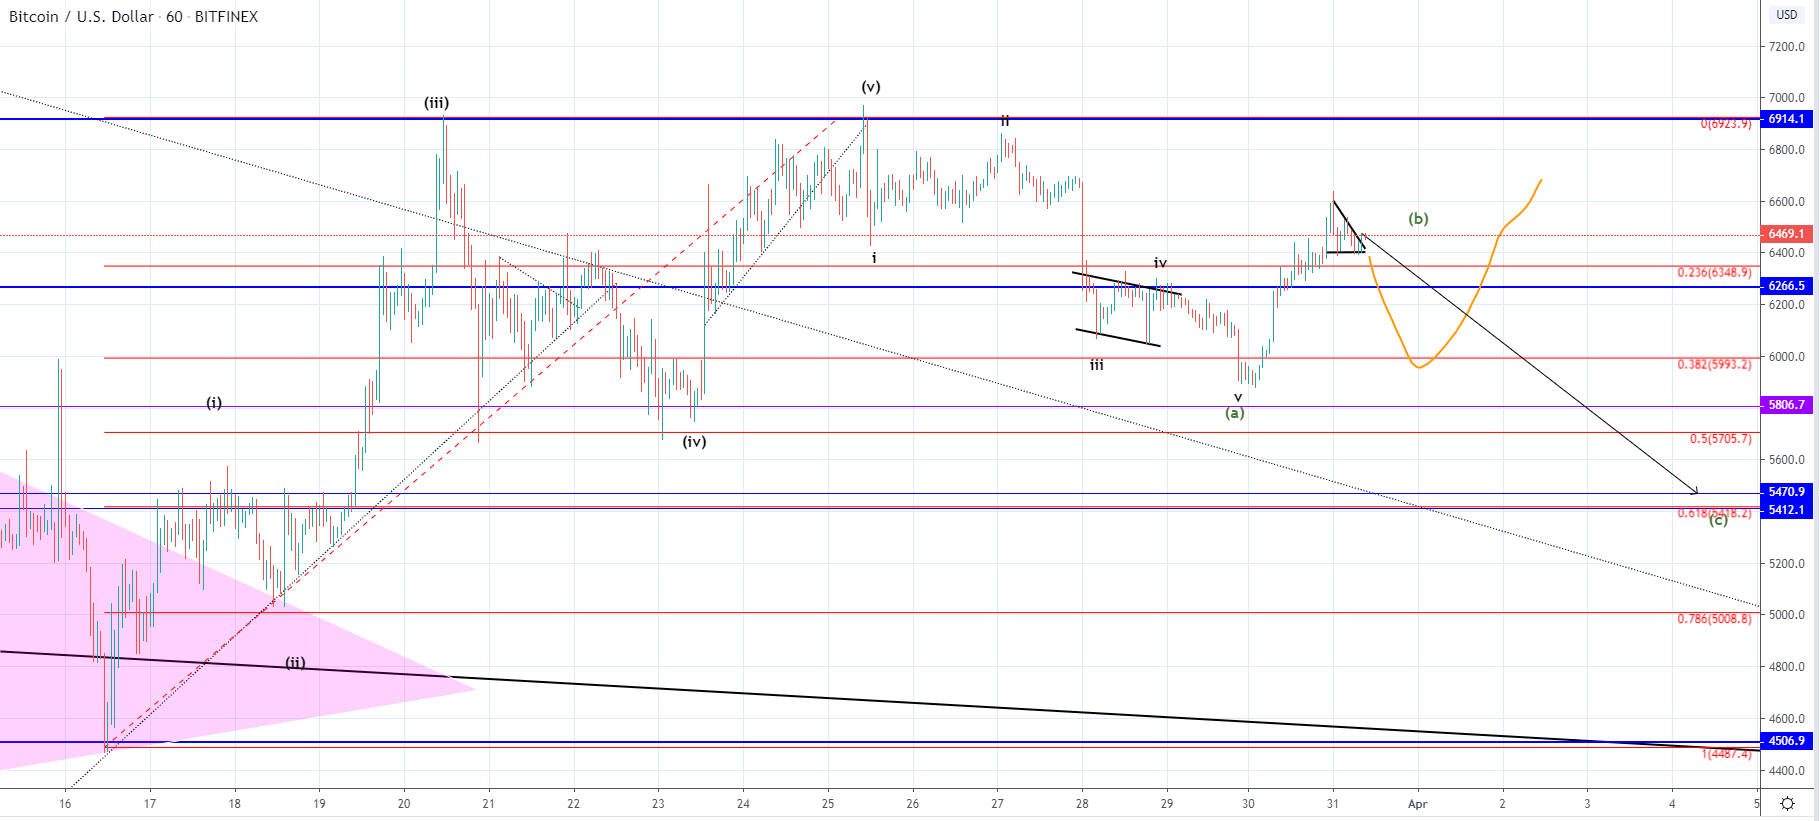
From yesterday’s low at $5883 the price of Bitcoin has increased by 11.3% as it came up to $6548 at it’s highest point today. Currently, the price is being traded slightly lower but has started to break out from the descending triangle on the upside which was formed after today’s high.
If that is true then it would develop and three-wave ABC Zigzag of a higher degree for which the C wave would come to around 0.618 Fib level at around $5420 which confirms the projected length of the presumed A wave on to the current ending point. Another possibility could be that the B wave hasn’t developed fully with the currently expected downside move being it’s second wave after which one more to the upside would start which is set to slightly exceed today’s high. This depends on the A wave’s sub-wave 5’s ending point, as if was like now labeled the B wave hasn’t ended, but if it ended on the descending channels support level at $6000 then the B wave ended with the expected downside move being it’s starting C wave.
XRP/USD
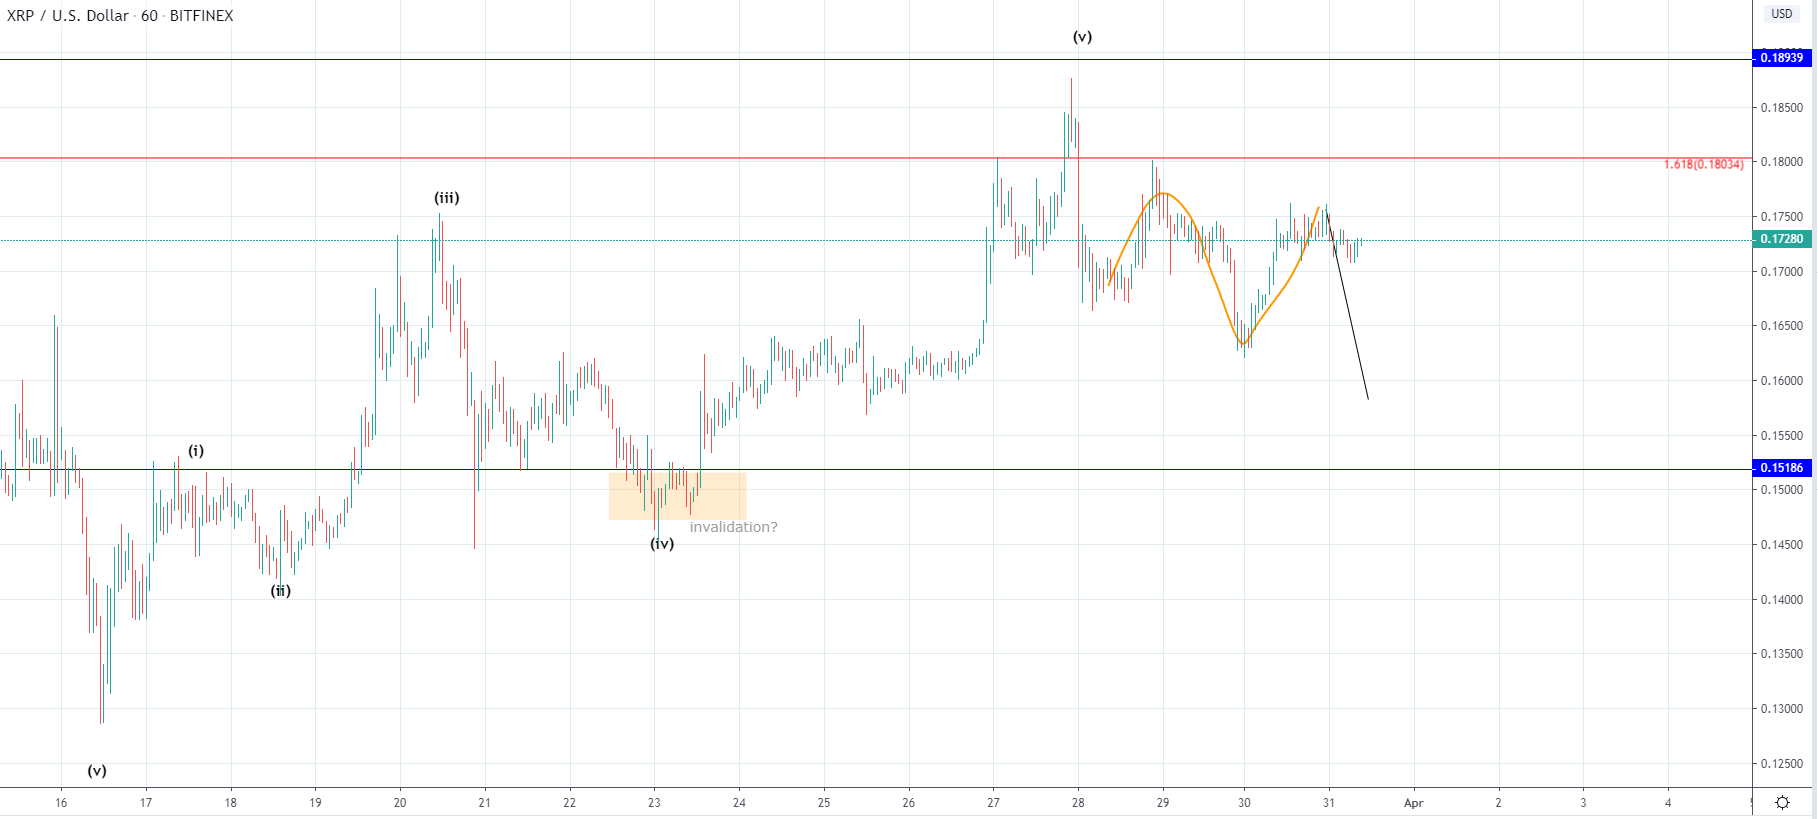
The price of Ripple has increased from yesterday’s low at $0.163 to $0.17619 which was an increase of around 8%. Since then we have seen a slight decrease but the price is still hovering above it’s significant support level.
The move to the downside which is expected to start shortly would, in that case, be the C wave or the 3rd wave if the next move is another starting impulse to the downside, but in either way further decline would be anticipated to at least somewhere around the significant horizontal level at $0.152