


Descending Triangle Pattern: Rules and Signals
FXOpen
A descending triangle is one of the patterns of a triangle group. The descending triangle is one of the most common technical analysis tools that can be spotted on price charts of any asset. Therefore, traders like implementing it in their trading strategies. However, this formation may be challenging. Read on to learn how to distinguish between the descending triangle signals.

What Is a Descending Triangle Pattern?
A descending or falling triangle is a bearish formation that is usually formed in downtrends. Thus, it signals a trend continuation. Although it is believed that a descending triangle pattern can occur in an uptrend, the theory states that it must form during a downtrend to provide strong signals.
The triangle consists of two trendlines: a horizontal lower line, which connects swing lows, and a falling upper line, which goes through declining swing highs. The formation occurs in periods of market consolidations.
The psychology behind the pattern is that sellers try to pull the price down but fail due to a strong support level, so the price rebounds. That is, the price bounces back and forth within a triangle between the two trendlines. Still, sellers are strong, which is reflected in lower highs. The idea is that sellers' strength allows them to pull the price below the support level despite the short-term consolidation.
An advantage of triangles is that they can appear on any timeframe. Therefore, the period during which the triangle exists depends on the period of the price chart. For instance, on a daily chart, the triangle may exist for over a week, while on an hourly chart, it's usually in place for several hours.
Descending, Ascending, and Symmetrical Triangles: The Differences
The triangle group of patterns includes descending, ascending, and symmetrical triangles. While a descending triangle pattern provides bearish signals, an ascending triangle may be a sign of a price rise, and a symmetrical triangle may appear ahead of both the rise and fall of a price.
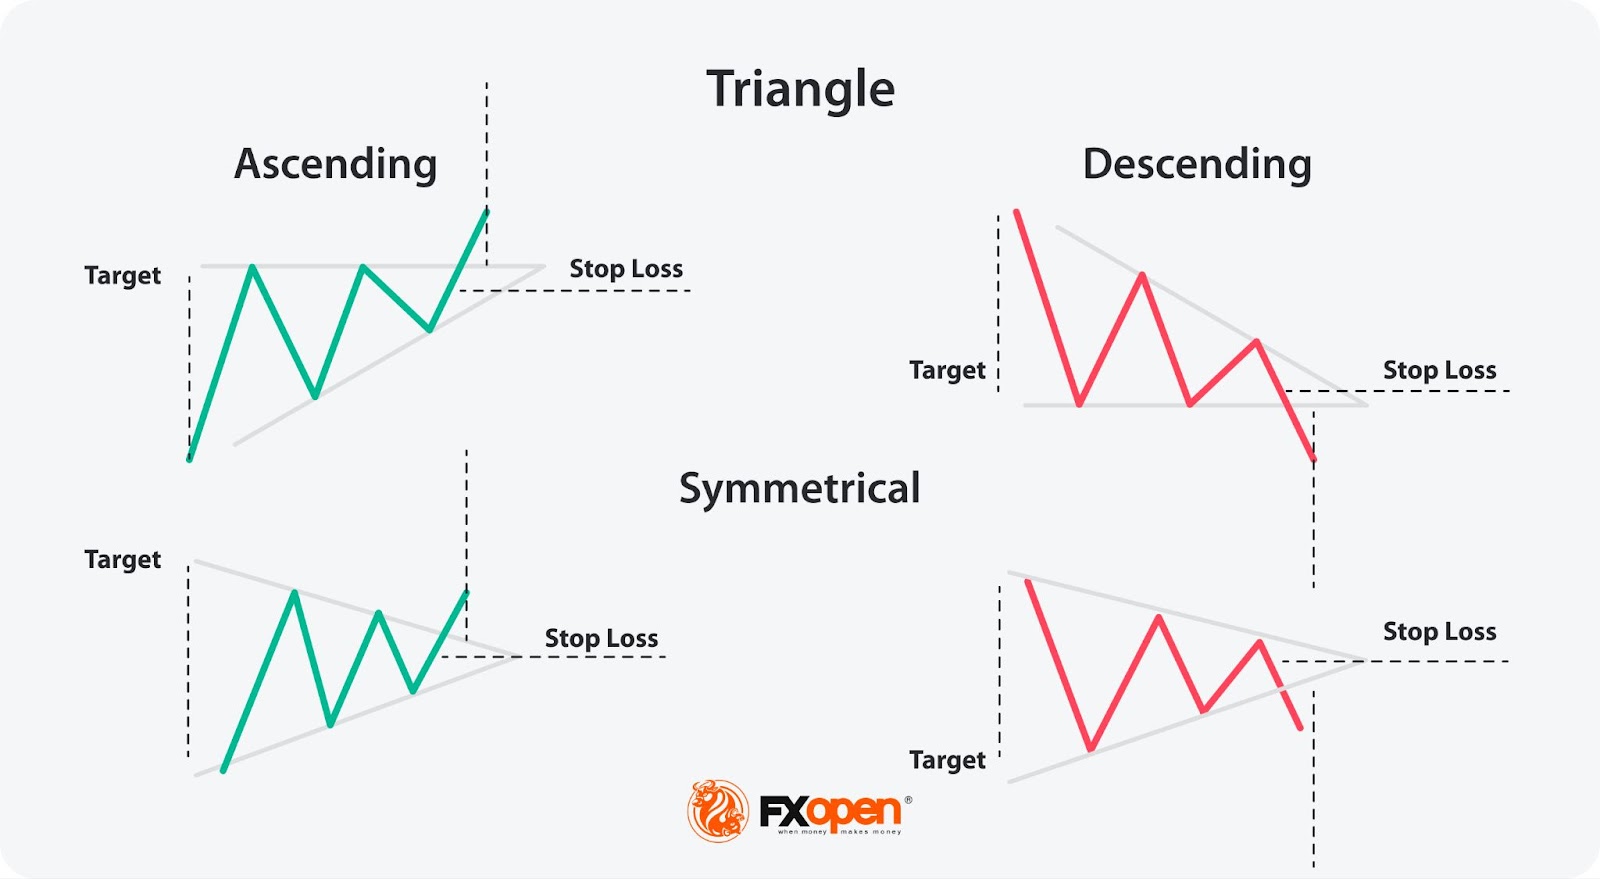
The picture above shows the differences between the three formations:
- The descending triangle has a horizontal lower boundary, while the upper boundary is angled down.
- The ascending triangle has a horizontal upper trendline, while the lower trendline is angled up.
- The symmetrical triangle has a falling upper boundary and a rising lower boundary.
Descending Triangle: Trading Rules
As with many chart patterns, the descending triangle has specific entry and exit rules. You can change them if you have enough experience so they work for your trading approach. If you don't have time or willingness to develop new trading methods, you may use general rules. Both methods can be tested on live charts. For this, you can open an FXOpen account and enjoy spreads as tight as 0.0 pips and low commissions of $1.50 per lot.
Entry
The idea of the descending triangle chart pattern is to show that sellers are strong and can take control of the market. Therefore, traders open a sell position after the price breaks below the lower band.
According to the theory, there are two options. First, a trader goes short as soon as the price falls below the lower trendline, and the descending triangle’s breakout candlestick closes below it. Second, a trader goes short after at least several candlesticks are formed in the breakout direction.
Although triangles are considered reliable, they may fail – a breakout may be false, which means the price may return. Some believe that the descending triangle provides reversal signals in this case, but it only means that the pattern fails. Traders use various methods to confirm triangle signals.
A real breakout is accompanied by high trading volumes. If the price breaks below the lower trendline but the selling volumes aren't higher than those before the breakout, there is a risk the price will return.
To confirm a descending triangle pattern, traders use trend indicators and oscillators. A commonly used approach is to compare the short-term and long-term simple moving averages. For example, if the 20-day SMA is below the 50-day SMA, it indicates a bearish trend, aligning with the descending triangle pattern. Additionally, traders can use the Moving Average Convergence Divergence (MACD) indicator. A bearish MACD crossover, where the MACD line crosses below the signal line, supports the bearish signal of the descending triangle.
Oscillators like the Relative Strength Index (RSI) are useful to gauge momentum and potential reversal points. When the RSI breaks below 50, it suggests bearish market sentiment.
Take Profit
The theory states that the take-profit target equals the largest distance between the triangle’s upper and lower boundaries and is measured from the breakout point.
Stop Loss
A stop-loss distance is typically measured in a few ways. The first option is the risk/reward ratio. The theory suggests that the ratio of 1:2 and 1:3 is the most common. However, it depends on the trader’s risk aversion. Also, traders set the stop-loss order just above the lower trendline.
Descending Triangle: Trading Example
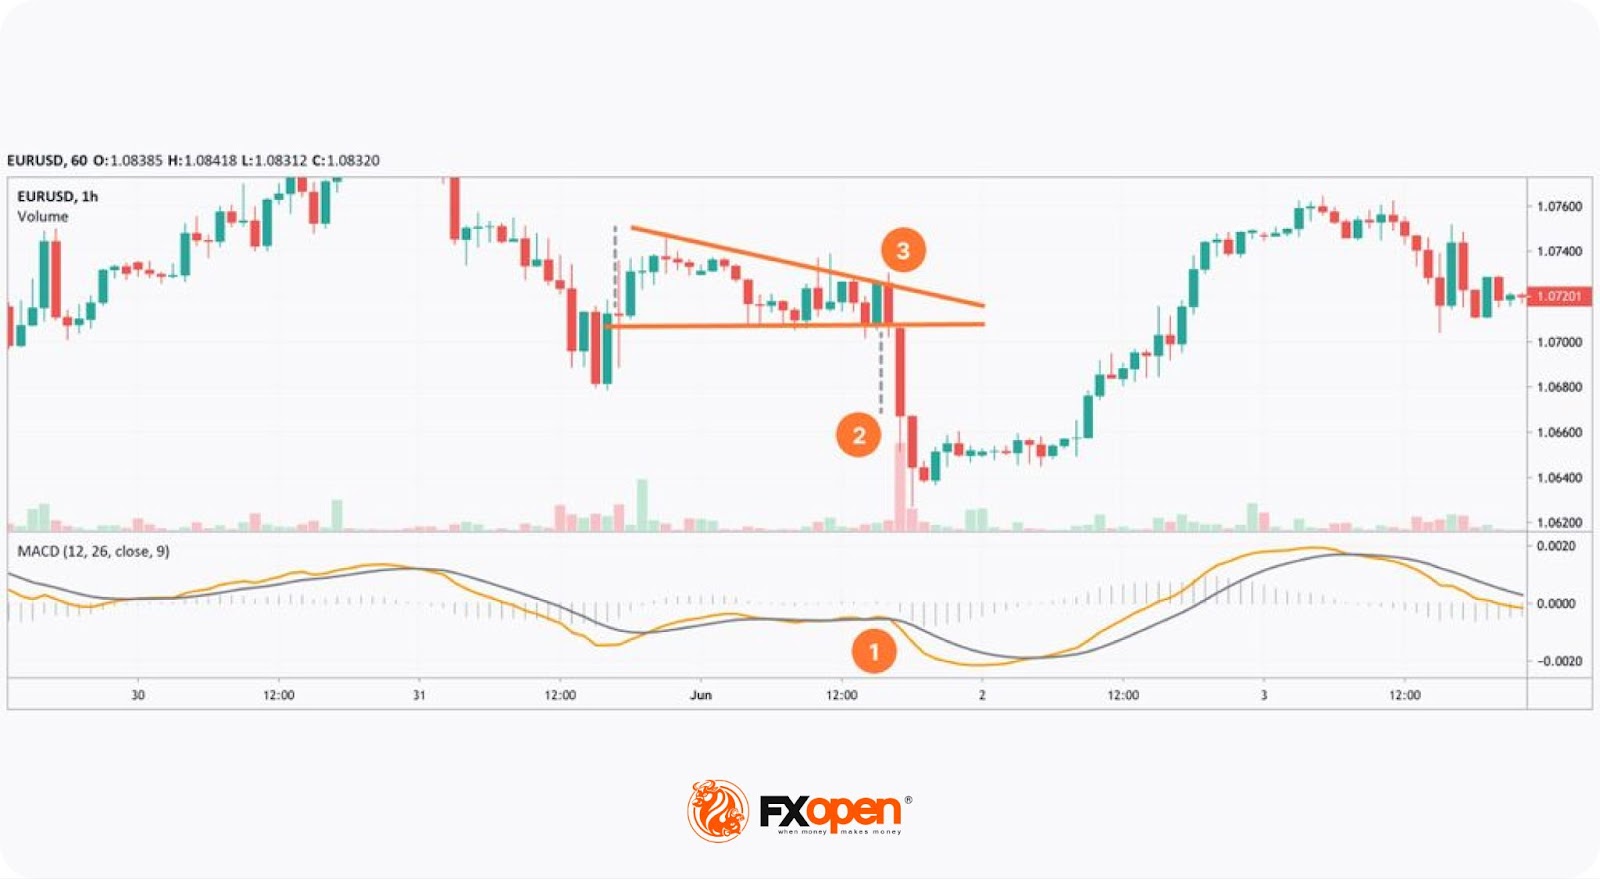
The chart above shows a descending triangle setup in a downtrend. If a trader used standard rules and opened a sell position after the breakout candlestick closed, the pattern rules couldn’t be applied anymore as the target would be reached. Therefore, a trader could consider a surge in volumes and a sell signal of the MACD indicator to open a position earlier during the breakout candle formation (1).
A take-profit level would equal the widest part of the setup and is measured from the lower trendline (2). However, significant trading volumes would allow a trader to trail the take-profit target. A stop-loss order could be half of the take-profit size or be placed above the upper band of the triangle (3).
Falling Triangle: Benefits and Drawbacks
The falling triangle has advantages and disadvantages that may affect your trades.
Benefits
- It appears in any timeframe. Triangles can occur in any timeframe. Still, as the falling triangle is a consolidation formation, its signals may be stronger in solid trends, thus, on charts with longer periods.
- It can be used when trading various assets. Descending triangles can be found on a chart of any asset. It’s common to find descending triangles on stock, commodity, index, cryptocurrency*, and currency price charts.
- It’s easy to spot. The formation consists of two trendlines, which are standard tools on any trading platform. You can examine how to place trendlines on the TickTrader trading platform.
- It provides exact entry and exit points. Triangles provide traders with particular entry and exit points. They don’t guarantee an effective trade but help traders with little experience and those who develop their own trading strategies.
Drawbacks
- It may confuse traders. Is the descending triangle bullish or bearish? Traders constantly ask this question because this setup usually provides continuation signals but may appear before the downtrend reversal.
- It bears the risk of false breakouts. Every breakout strategy bears the risk of a fakeout. Therefore, traders use additional confirmation tools.
- Its trading rules may not work. Standard pattern rules are supposed to work in most market conditions, but there is no guarantee. It’s a well-known fact that every trade bears risks.
The Bottom Line
The descending triangle is used by many traders, especially in the forex markets. However, it doesn’t mean that it always provides effective signals. Every trading and investing activity involves risks. Therefore, you should practise and learn new analysis techniques to be equipped with various tools. Open a trading account at FXOpen to use your own trading strategies with the bearish triangle pattern.
FAQ
How to Identify a Descending Triangle Pattern?
A descending triangle pattern is identified by a series of lower highs that form a downward-sloping resistance line and a relatively flat support line at the bottom. This creates a triangular shape. The pattern typically forms during a downtrend and signals its potential continuation.
Is a Descending Triangle Bullish or Bearish?
A descending triangle is generally considered a bearish pattern. It indicates that sellers are gaining strength over buyers, as evidenced by the lower highs. The flat support line suggests that buyers are unable to push the price higher, and a breakdown below this support level often leads to further declines.
What Happens After a Descending Triangle Pattern?
After a descending triangle pattern, if the price breaks below the support line, it often leads to a continuation of the downtrend. The breakdown usually comes with increased selling pressure and volume, confirming the bearish sentiment. However, it's essential to watch for potential false breakouts and ensure the breakdown is sustained.
Which Way Does a Descending Triangle Break?
A descending triangle typically breaks to the downside. The flat support line indicates a level where buyers are stepping in, but the lower highs show that sellers are becoming increasingly aggressive. When the support line fails to hold, it usually results in a downward breakout.
What Is the Target Price of a Descending Triangle?
The target price of a descending triangle can be estimated by measuring the height of the triangle at its widest point and then subtracting that distance from the breakout level.
*At FXOpen UK and FXOpen AU, Cryptocurrency CFDs are only available for trading by those clients categorised as Professional clients under FCA Rules and Professional clients under ASIC Rules, respectively. They are not available for trading by Retail clients.
This article represents the opinion of the Companies operating under the FXOpen brand only. It is not to be construed as an offer, solicitation, or recommendation with respect to products and services provided by the Companies operating under the FXOpen brand, nor is it to be considered financial advice.
Stay ahead of the market!
Subscribe now to our mailing list and receive the latest market news and insights delivered directly to your inbox.


Latest articles

US Dollar Index Analysis: Dollar at a Crucial Point, What's Next?
As the chart shows, the US Dollar Index (DXY) has gained more than 4% from its January lows, with the move accelerating from February 2026 onwards. Today, the dollar finds itself at a technically and fundamentally critical point, one that

US Natural Gas: Inventory Surplus Continues to Weigh on Prices
The US natural gas market (XNG/USD) is entering the summer season under the influence of two opposing forces. Domestically, the picture remains bearish. According to the EIA, working gas in underground storage stood at 2,688 billion cubic feet

Forex Kill Zone Times and ICT Trading Sessions
Kill Zone trading is a