


FXOpen
BTC/USD
From yesterday’s high at $7193 the price of Bitcoin decreased by 4.07% today as it came down to $6905 at its lowest point. The price is currently still being traded around those levels with the price resting at the horizontal level in proximity.
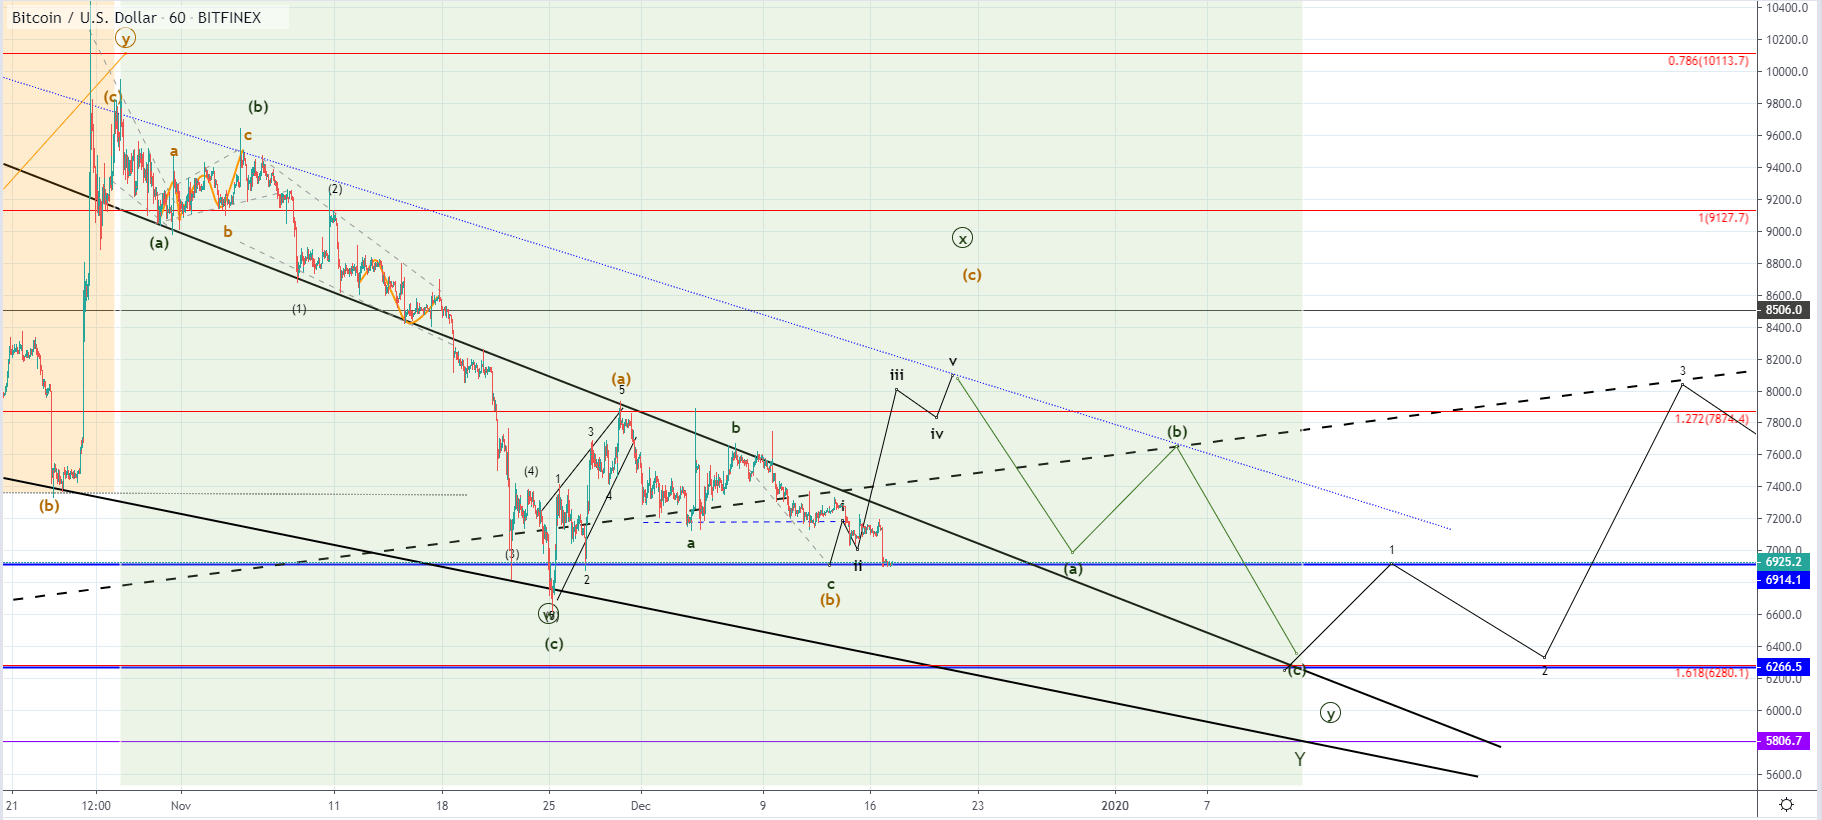 On the hourly chart, you can see that the price fell back to the projected level at around $6914 which is presumed to be the C wave out of the lower degree ABC correction and projected with the A wave’s length. This is the B wave of a higher degree as the second corrective wave after the leading diagonal retested the 1.272 Fibonacci level. In theory, it could go below the previous low but considering the significance of the horizontal support level which is currently being retested, I don’t believe that it will go much further.
We are yet to see if the support level holds but if it does I would be expecting the start of the C wave to the upside which is to lead the price of Bitcoin retesting some of the significant resistance levels. The furthers one would be the descending channel’s resistance which would bring the price above $8000. But is this is considered as a corrective three-wave move to the upside this recovery would be short-lived as another three-wave move to the downside would be expected.
XRP/USD
The price of Ripple has fallen below $0.2 mark for the first time after in two years. The downfall was made from $0.21881 on yesterday’s open to $0.19031 at its lowest spike today. Currently, the price is being traded at $0.19865 and is showing minor bullish signs.
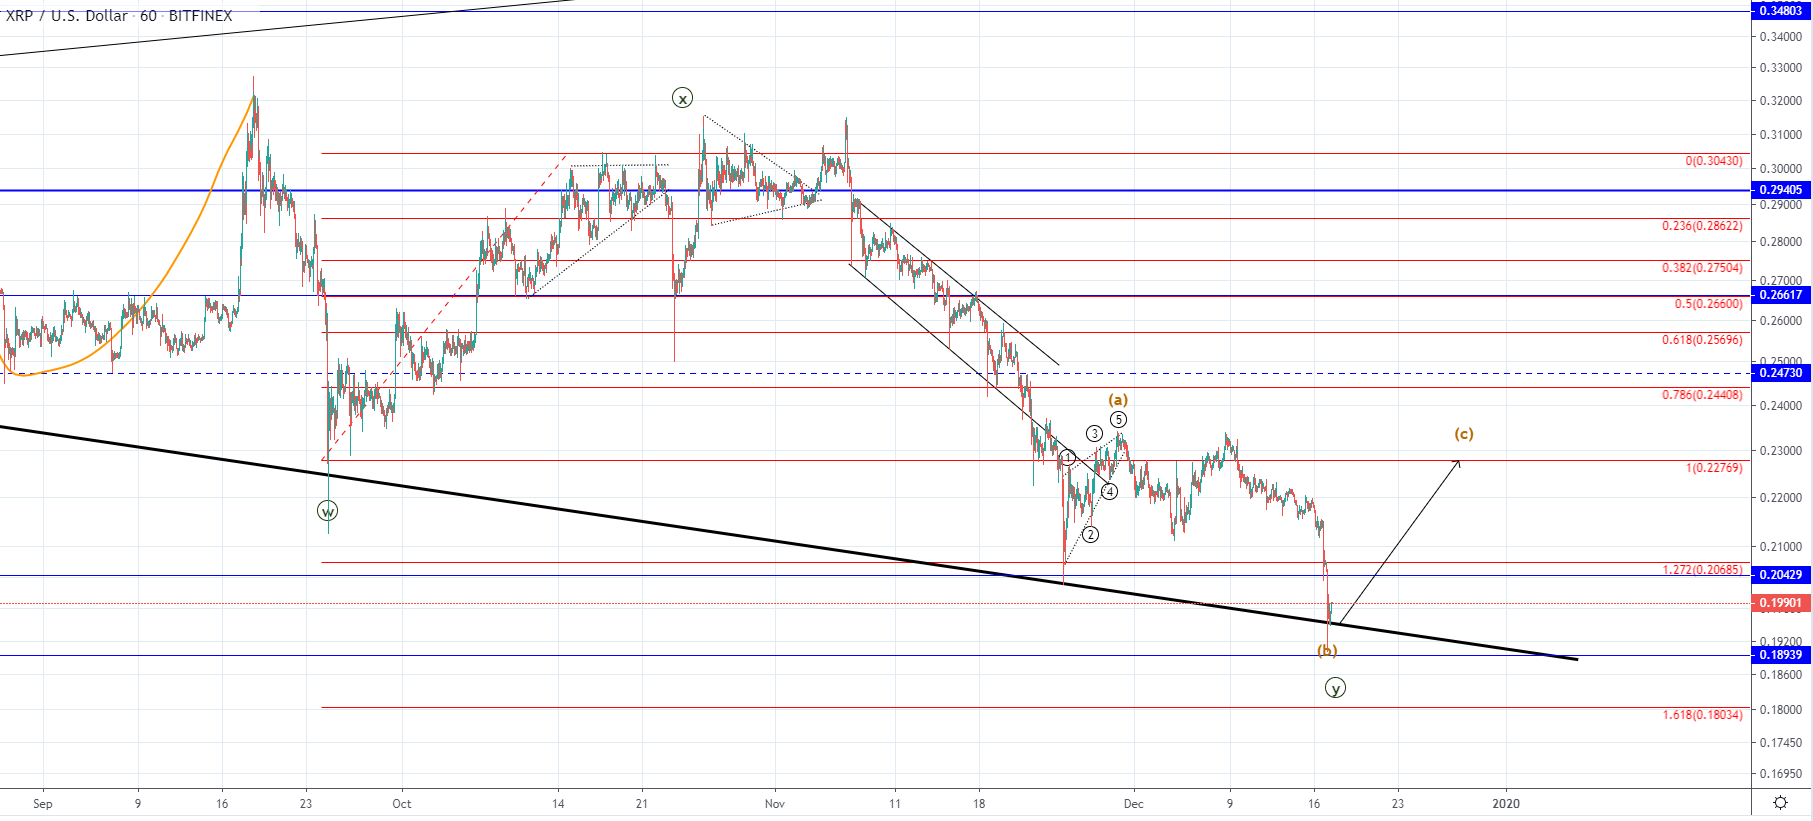 Looking at the hourly chart, you can see that this downfall is like in the case of Bitcoin expected to end shortly as we have seen interaction with the descending support level with a large wick from the buyer’s side. The price would be expected to start moving to the upside now but potentially maintaining in a downtrend as it can be corrective in nature.
Another possibility can be that we have seen the end of the Y wave in which case today’s low is the last wave from the decline which started on the 7th of November. But my primary count is that we are seeing another ABC correction to the upside after which further depreciation could occur. In either way, from here I would be expecting an increase from which we are to evaluate the possibility.
FXOpen offers the world's most popular cryptocurrency CFDs*, including Bitcoin and Ethereum. Floating spreads, 1:2 leverage — at your service. Open your trading account now or learn more about crypto CFD trading with FXOpen.
*Important: At FXOpen UK, Cryptocurrency trading via CFDs is only available to our Professional clients. They are not available for trading by Retail clients. To find out more information about how this may affect you, please get in touch with our team.
This article represents the opinion of the Companies operating under the FXOpen brand only. It is not to be construed as an offer, solicitation, or recommendation with respect to products and services provided by the Companies operating under the FXOpen brand, nor is it to be considered financial advice.
Stay ahead of the market!
Subscribe now to our mailing list and receive the latest market news and insights delivered directly to your inbox.


Latest articles


XBR/USD Chart Analysis: Price Rebounds from a Seven-Week Low
On 1 December, we outlined a descending channel on the XBR/USD chart and noted that the bearish trend was driven by fading geopolitical risks. Indeed, hopes for an end to the war in Ukraine—along with the possibility of

Silver Price Hits Historic Record Around $64
On 27 November, we suggested that silver was preparing to challenge its all-time high. Since then (marked with the orange arrow), XAG/USD has risen by roughly 18%, breaking above the psychological $60-per-ounce threshold for the first time in history.