BTC and XRP - Lower lows expected but a recovery is soon to start
BTC/USD
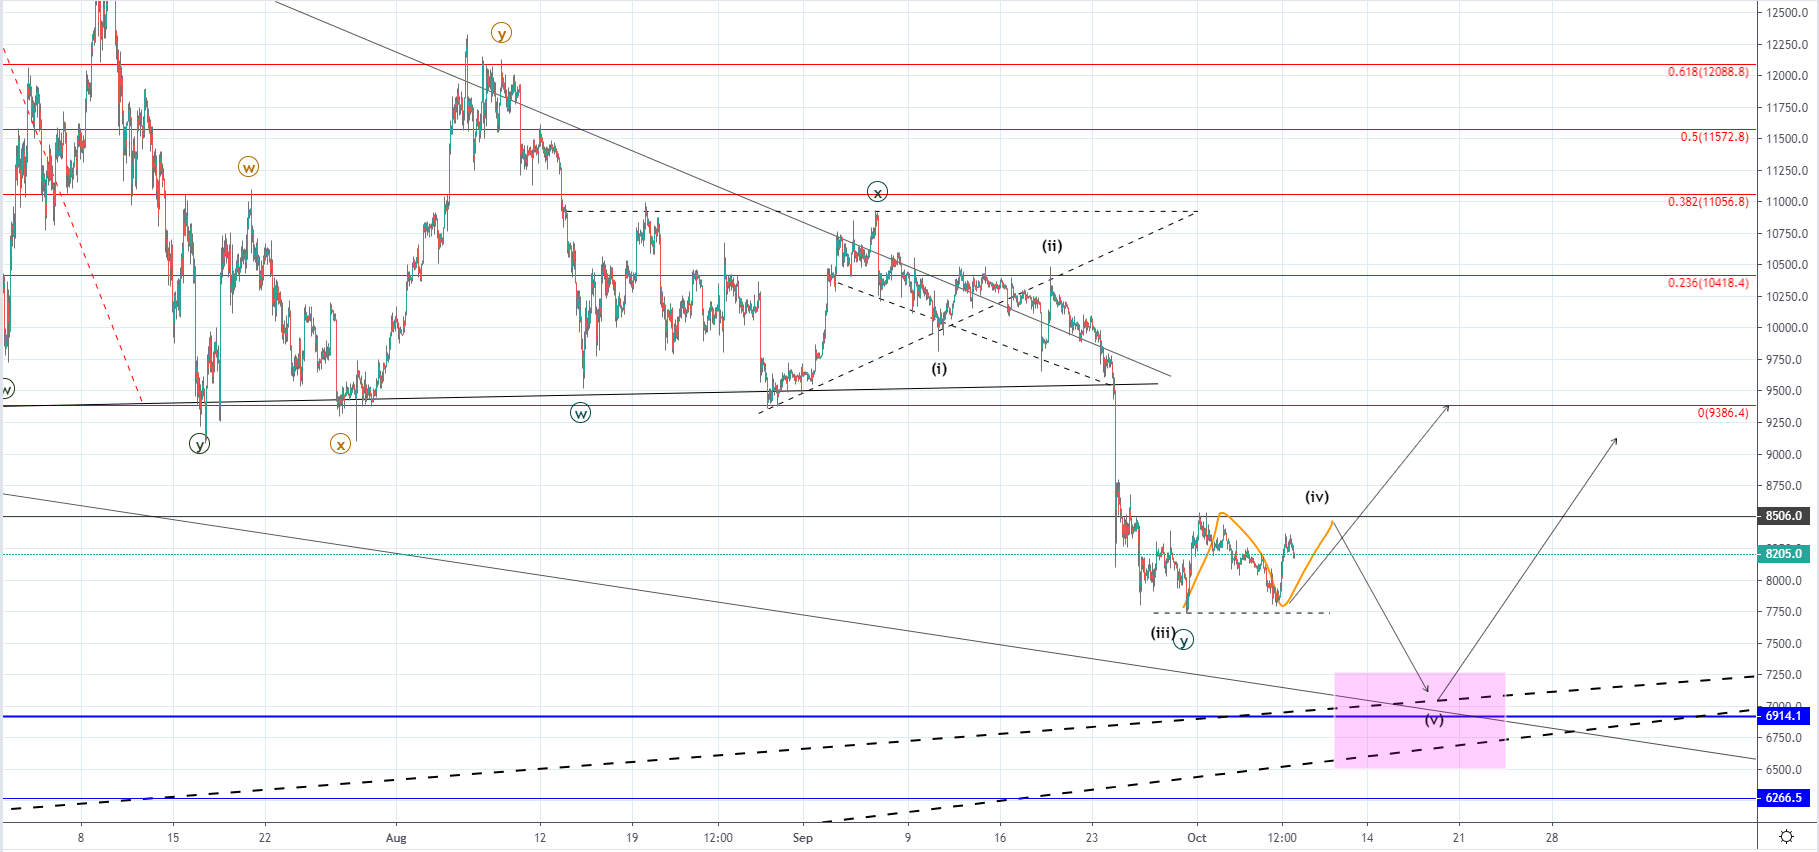
The price of Bitcoin has been stuck in a horizontal range since last Monday when it fell to $7758 with strong bearish momentum which is the support level of the mentioned range and retested the $8500 level which is its resistance. This horizontal range could be interpreted as a consolidative range after a breakout has been seen from the descending triangle but it is still unclear whether or no the price headed further to the downside from here or are we going to see the recovery starting soon.
If the decline continues it would most likely end at the highly significant support intersection of multiple ascending and horizontal levels around $7000. In either way, soon a trend reversal is expected to start from we are to see if the price has entered the longer-term downtrend or are we seeing the price continuing its upward movement.
XRP/USD
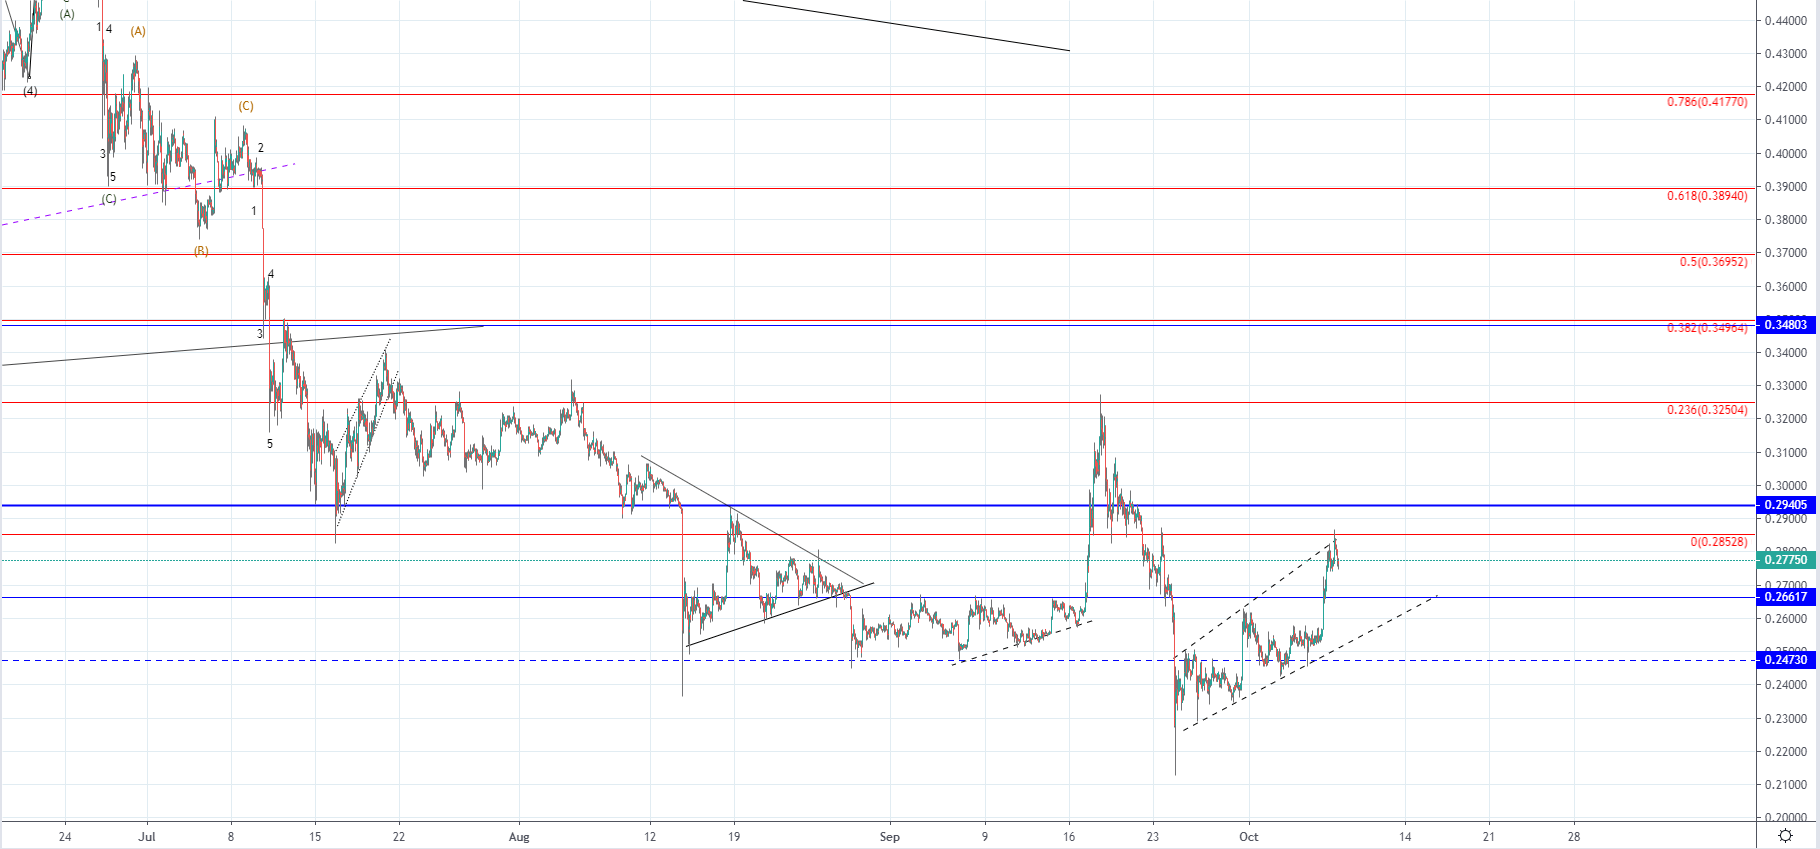
From yesterday’s open at $0.2535 the price of Ripple has increased by 11.88% as it came up today to $0.28528 at its highest point. Currently, the price is trading slightly lower as interaction has been made with the 0 Fib level which is the lower level of the significant horizontal support zone around $0.294.
As you can see from the hourly chart, the price of Ripple has also reached the resistance level of the ascending channel which was formed from the prior low made on the 24th of September when the price dipped below the $0.2473 horizontal level. This implicates that now most likely we are to see a retracement back to either the support level of the descending channel or some of the significant horizontal support levels out of which the most recent one at $0.26617 would look more likely.
If the price continues increasing from here and manages to enter the upper range above the 0 Fib level and the $0.29405 support it would need to do so with strong momentum as the support zone now serves as strong resistance. This momentum has been shown since yesterday’s open but like the previous spike that ended in a downfall, we could be seeing another corrective ascending structure.