


FXOpen
BTC/USD
Last week the price of Bitcoin was $10641.1 at its highest point on Monday. From there we’ve seen the price decreasing until Wednesday when the price started recovering and came to $10168 which was again retested on Saturday but since the price failed to exceed the prior high another shart downfall has been seen to $9367 on the same day.
Since then the price has been hovering in a horizontal range between the Saturday’s low and $9580 but the price spiked to the downside and retested the prior low on a quick spike after which a retest of the 0 Fib level has been made. This horizontal range could be interpreted as a consolidative range after the price fell below the 0 Fib level and is likely a sign of indecision.
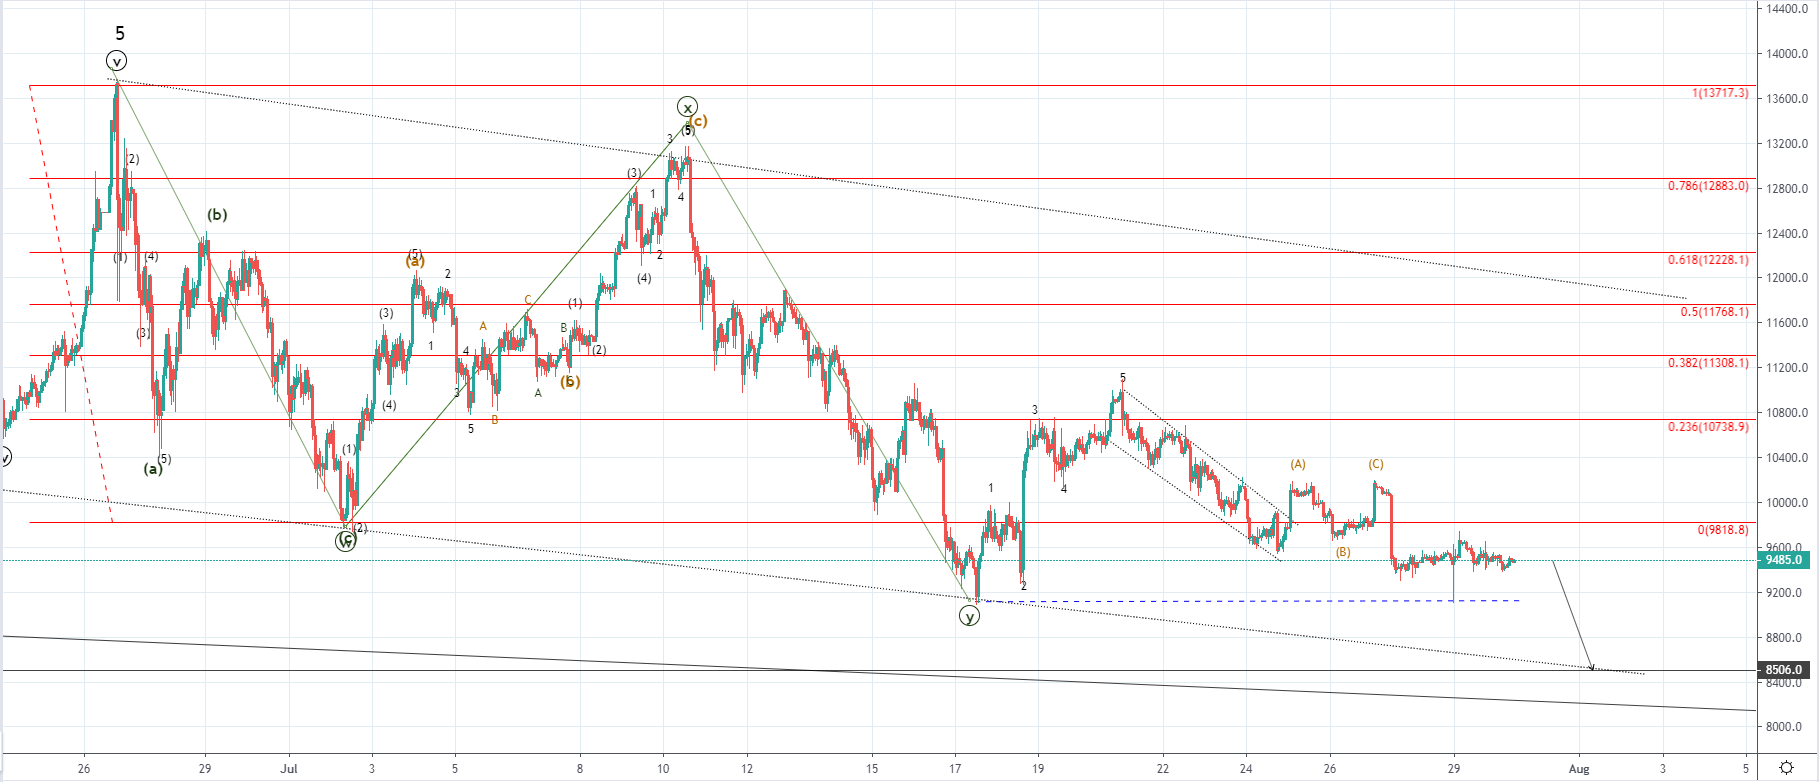 On the hourly chart, you can see that the price of Bitcoin attempted to start moving to the upside after it fell below the 0 Fib level but failed to do so and instead formed a three-wave upward correction after which another downside move has been seen. This could mean that the price is headed for another downside move before the completion of the downtrend which started on the 20th of July when the price of Bitcoin was $10970 above the 0.236 Fib level.
If we see another downside move I wouldn’t believe that it’s going below the still unconfirmed descending trendline and the intersection with the horizontal level at $8506 but its equally possible that the price would be headed upward from here as this downtrend from the 20th of July could be the 2nd wave out of the next structure to the upside as the WXY correction ended.
The price of Bitcoin most likely ended its 5th wave to the upside of the Minor degree on the yearly high which is why we are seeing a corrective downside move as the first wave out of the same degree starting downtrend but this could also be a prolongation of the corrective decrease after the uptrend continues.
Considering that the price of Bitcoin has been in an upward trajectory since 15th of December we are most likely seeing the first formation in the entering bearish period so in either way even if the price is to increase from here I would be expecting further decrease below $8500 in the upcoming period.
XRP/USD
The price of Ripple has been following the chart pattern of Bitcoin as like in the case of Bitcoin we’ve seen a horizontal range after an attempt for a recovery ended as a failure with the price decreasing over the weekend. From last weeks high at $0.3303 we have seen a decrease to $0.305 at its lowest point after which recovery to the 0.236 Fib level occurred but the price got rejected by the resistance found there and again fell to the mentioned low level.
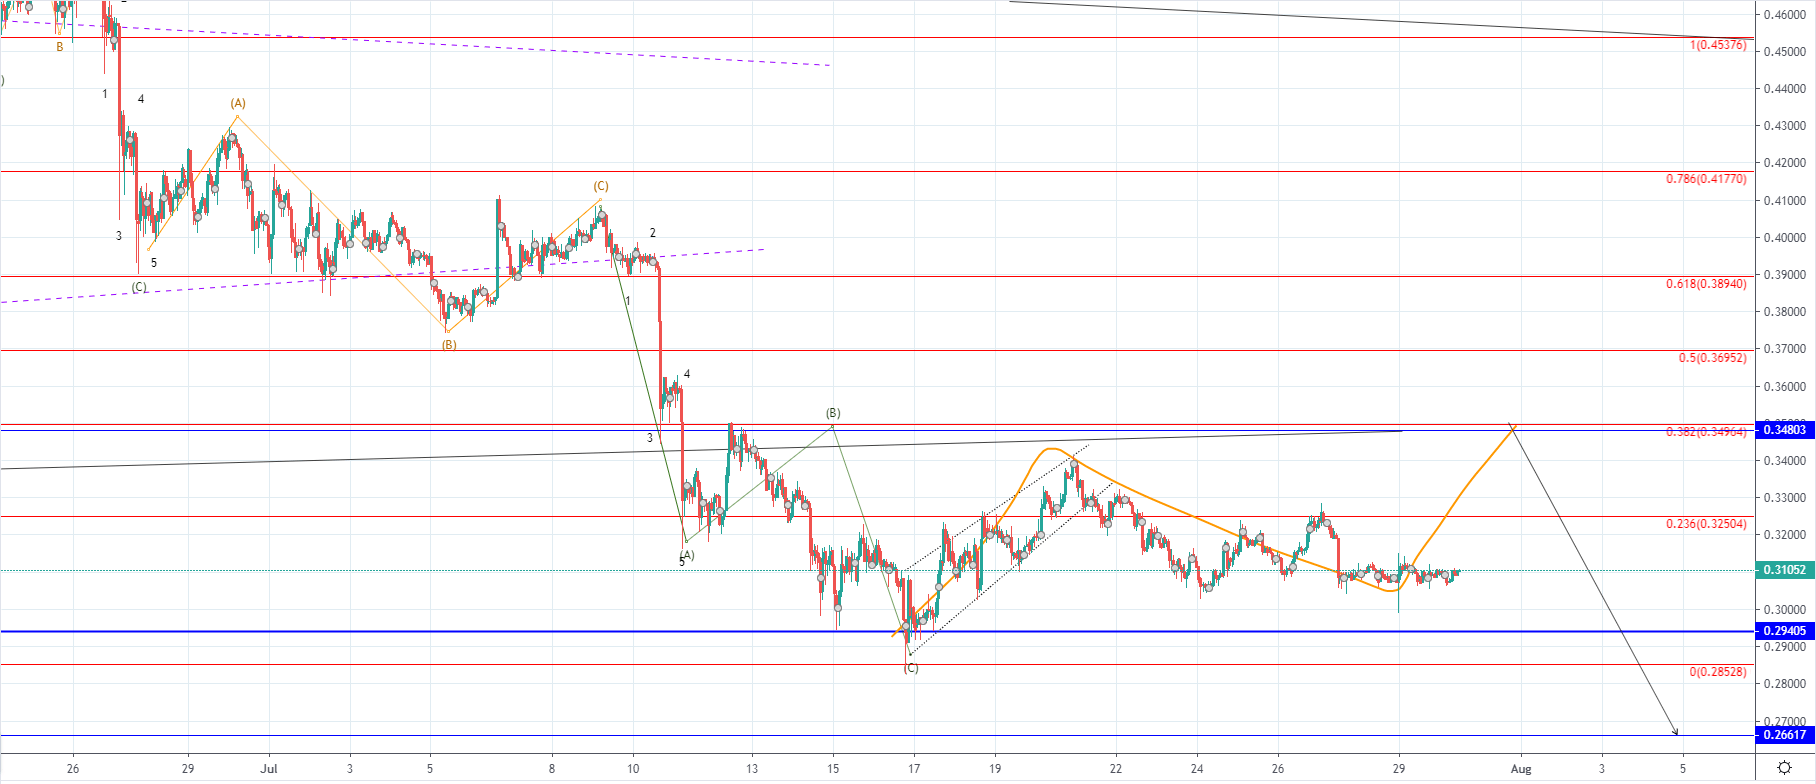 On the hourly chart, you can see that the price of Ripple is stuck in a horizontal range between the 0.236 Fib level and the $0.305 low which is most likely a consolidative range showing indecision as the price is stuck between significant horizontal support/resistance points. As we have seen an increase from the 0.29405 horizontal level to the 0.382 Fib level and a decrease after we are most likely seeing a higher degree three-wave correction to the upside after the prior downfall ended.
This is why I would be expecting another increase from here to the 0.382 Fib level as another retest of the significant resistance point before another downside move to the lower horizontal support level. The likelihood of a breakout from both sides is equal at this point which is why I don’t believe that we are to see a decisive move soon, instead, more likely we are going to see further sideways movement in the upcoming period.
FXOpen offers the world's most popular cryptocurrency CFDs*, including Bitcoin and Ethereum. Floating spreads, 1:2 leverage — at your service (additional fees may apply). Open your trading account now or learn more about crypto CFD trading with FXOpen.
*Important: At FXOpen UK, Cryptocurrency trading via CFDs is only available to our Professional clients. They are not available for trading by Retail clients. To find out more information about how this may affect you, please get in touch with our team.
This article represents the opinion of the Companies operating under the FXOpen brand only. It is not to be construed as an offer, solicitation, or recommendation with respect to products and services provided by the Companies operating under the FXOpen brand, nor is it to be considered financial advice.
Stay ahead of the market!
Subscribe now to our mailing list and receive the latest market news and insights delivered directly to your inbox.


Latest articles

EUR/USD Chart Analysis: Pair Recovers Ahead of Fed News
On 10 March, analysing the EUR/USD chart, we:
→ considered the long-term descending channel, which remains relevant;
→ noted that the sequence of lower lows A–H was broken with the appearance of a higher peak I, with 1.1680 potentially

Nvidia (NVDA) Shares Set a March High
Nvidia shares experienced heightened volatility yesterday, with the price jumping to a March high during the Nvidia GTC 2026 conference, where Jensen Huang made several major announcements. According to media reports:
→ Nvidia unveiled a next-generation platform named after the astronomer

XTI/USD Chart Analysis: WTI Oil Price Fluctuates Near $100
For the third Monday in a row, trading in the oil market has opened with a bullish gap, although this time it is not as wide as the gap seen, for example, on 9 March. The reason for the volatility