


BTC encounters resistance while XRP finds support
FXOpen
BTC/USD
The price of Bitcoin has been increasing from last Friday when it was sitting at $17,570 at its lowest point and came up by around 11.4% measured to its highest point today at $19,570. Now the price is being traded at $19,316 as it fell from today’s high and is now making a recovery.
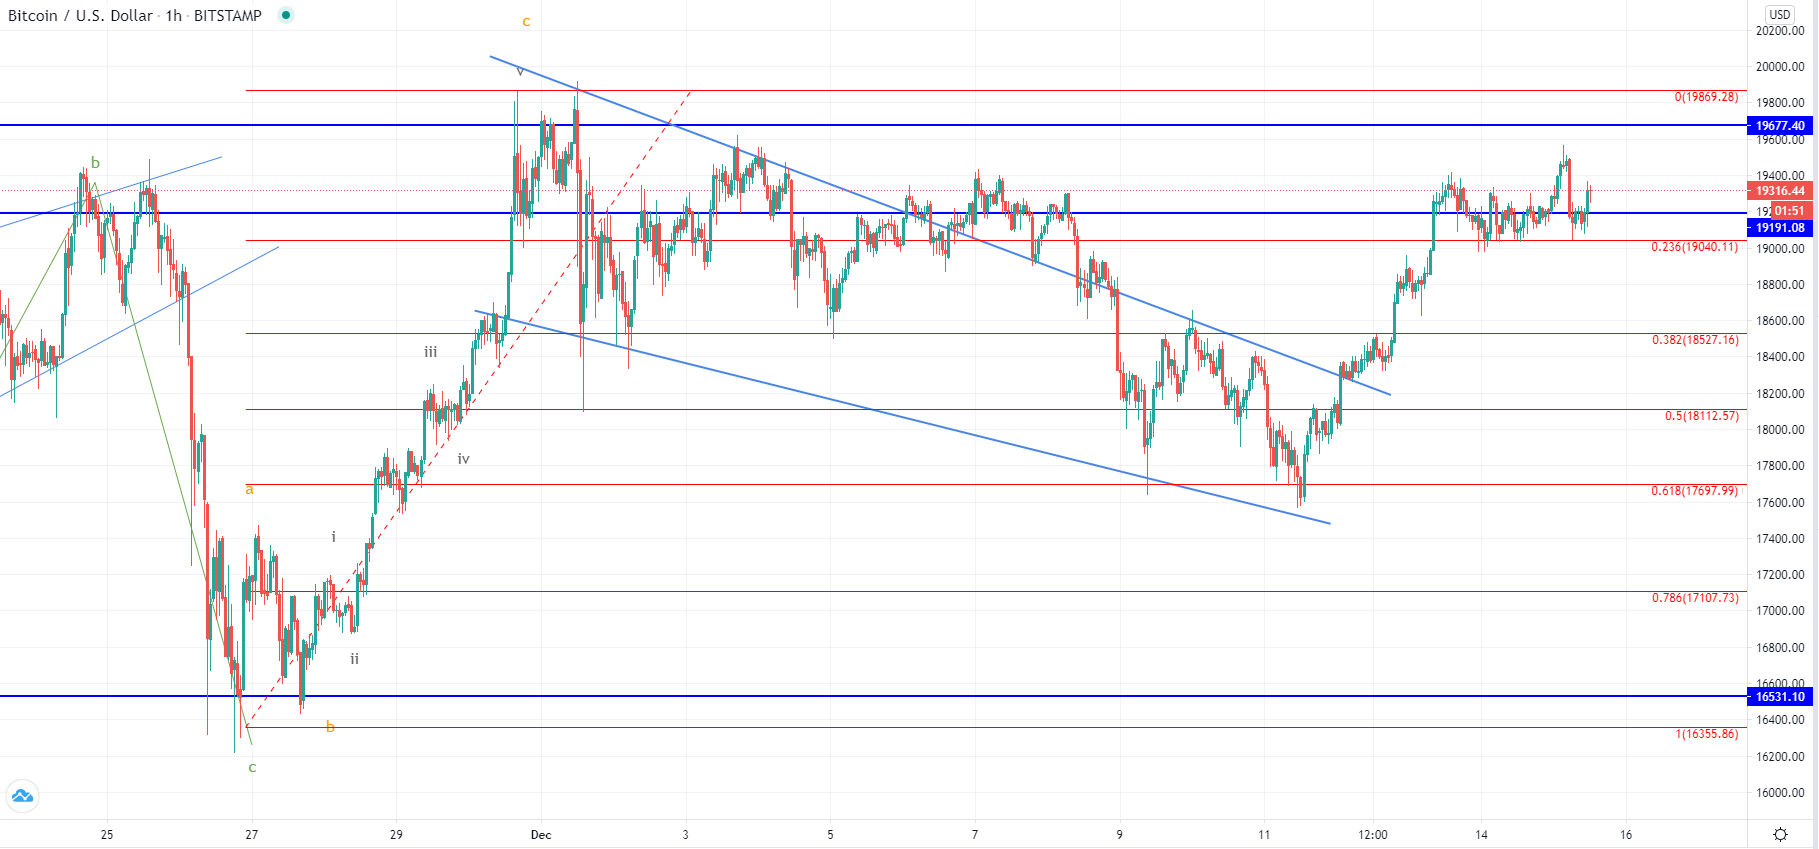
On the hourly chart, you can see that this is a struggle for the price to keep up its bullish momentum above the lower horizontal level at $19,191 which represents the daily candle close from the 2017 all-time high. Since the start of the month, we have seen the price in a decline, forming a descending channel from the 1st of December. Last Friday the price found support on the 0.618 Fib level and started increasing again, breaking out from this descending formation and coming above the significant lower horizontal level.
Now as the price is getting close to the vicinity of the high made on December 1st it has started moving sideways which indicates that resistance has been found. If this is the uptrend continuation after the descending channel was a higher degree retracement, the price is now headed towards is higher high, effectively making a new all-time high. But first, it needs to break this resistance zone in between the two horizontal resistance levels, so we are yet to see if the price manages to do so.
If the price gets rejected once more at this range we could see a lower low compared to the one made last Friday which would mean that the corrective move from the 26th of November hasn’t developed fully, but if it manages to surpass the $19,677 level it would indicate that is headed toward the $21,000 mark.
XRP/USD
The price of Ripple has been on a decline since the start of the month, coming down from $0.68 at its highest to $0.47656 at its lowest point today, which is a decrease of around 30%. Currently the price is being traded at $0.4839 but is still in a downward trajectory.
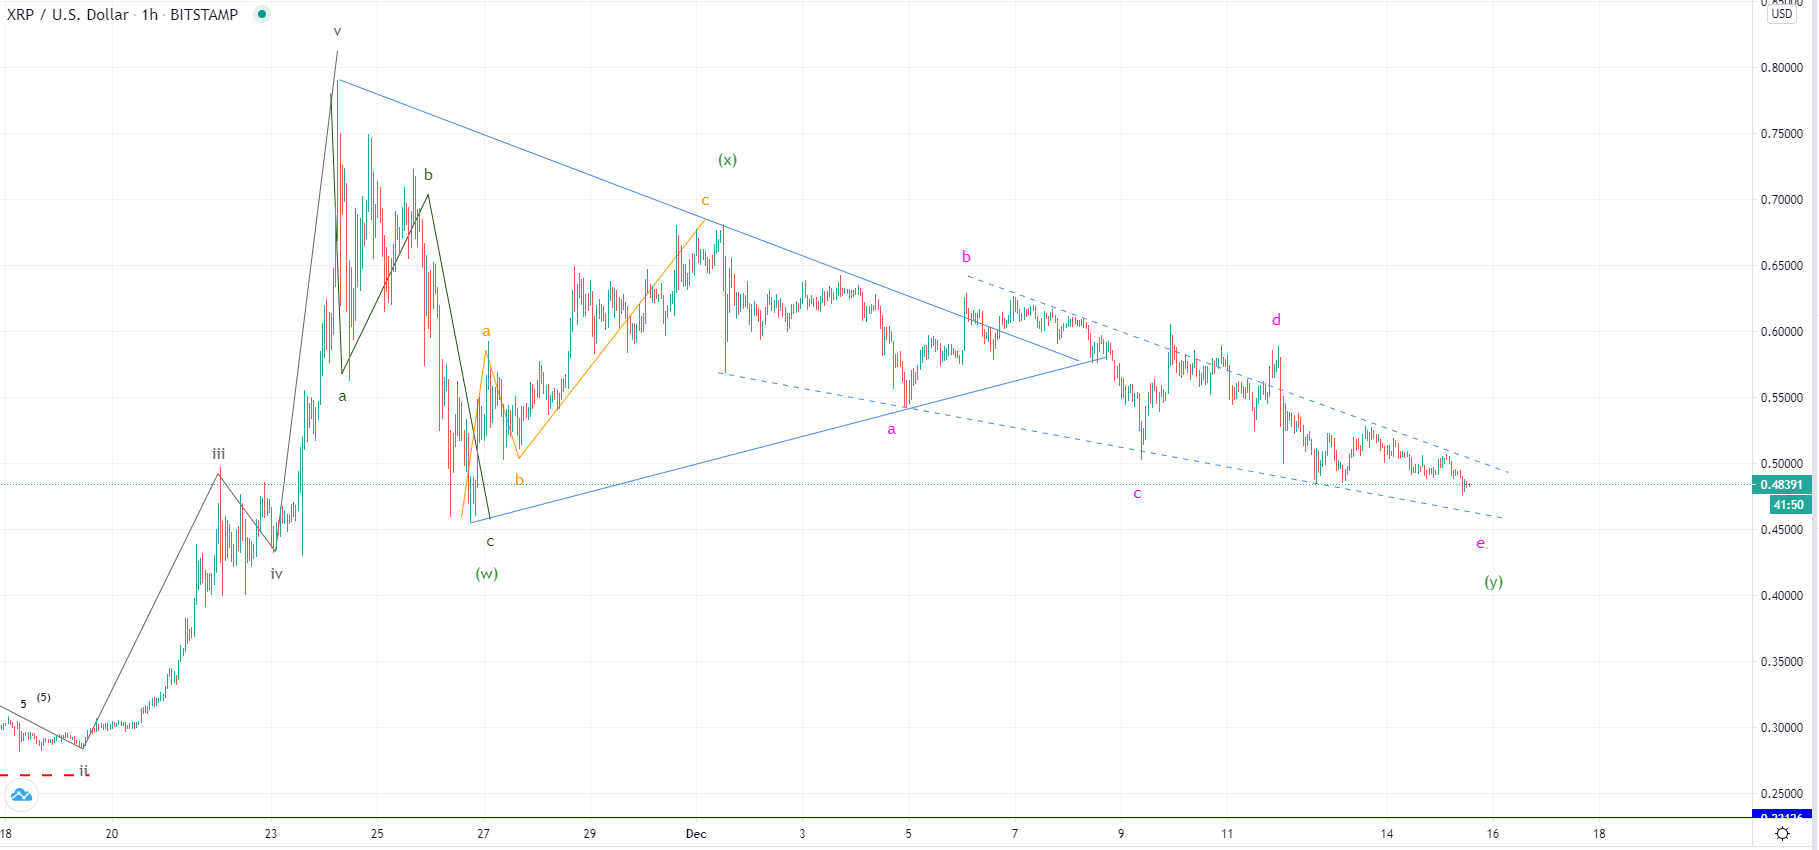
Looking at the hourly chart, we can see that the price has formed a significant corrective pattern from the 24th of November when it spiked to $0.79. First, we have seen a three-wave descending move with strong momentum, followed by a three-wave upward ABC a bit less steep, and after that a five-wave move to the downside which was developed slowly and wasn’t impulsively developed. These movements are constituting a higher degree WXY correction, which if we are now seeing the E from the five-wave move ABCDE correction is coming to a completion.
There is still a bit more room to go to the downside, to the interrupted support level and the $0.46 low made on the 26th of November before the correction ends, but after it does it would be expected that the price of Ripple continue moving to the upside again in an impulsive manner and potentially surpass its November’s high.
FXOpen offers the world's most popular cryptocurrency CFDs*, including Bitcoin and Ethereum. Floating spreads, 1:2 leverage — at your service (additional fees may apply). Open your trading account now or learn more about crypto CFD trading with FXOpen.
*Important: At FXOpen UK, Cryptocurrency trading via CFDs is only available to our Professional clients. They are not available for trading by Retail clients. To find out more information about how this may affect you, please get in touch with our team.
This article represents the opinion of the Companies operating under the FXOpen brand only. It is not to be construed as an offer, solicitation, or recommendation with respect to products and services provided by the Companies operating under the FXOpen brand, nor is it to be considered financial advice.
Stay ahead of the market!
Subscribe now to our mailing list and receive the latest market news and insights delivered directly to your inbox.


Latest articles

EUR/USD and GBP/USD consolidate ahead of the Fed decision
European currencies are showing subdued dynamics, entering a consolidation phase following their previous advance. Earlier, EUR/USD and GBP/USD broke out of their ranges and strengthened; however, the subsequent correction has led both pairs to retest the previously breached

Meta: V-Shaped Recovery Meets Heavy Volume Resistance
The movement in Meta Platforms shares is being driven by two competing narratives. On one hand, advertising revenue is benefiting from AI-based tools: the Advantage+ platform continues to support strong advertiser demand, and the analyst consensus for Q1 2026 revenue

Commodity Currencies Test Key Levels Ahead of Major Macro Data
Commodity-linked currencies are trading near key levels, showing restrained price action as market participants adopt a wait-and-see approach. The fundamental backdrop is shaped by expectations surrounding the release of Australia’s inflation data and the Bank of Canada’s interest