BTC still indecisive while XRP is looking bullish
BTC/USD
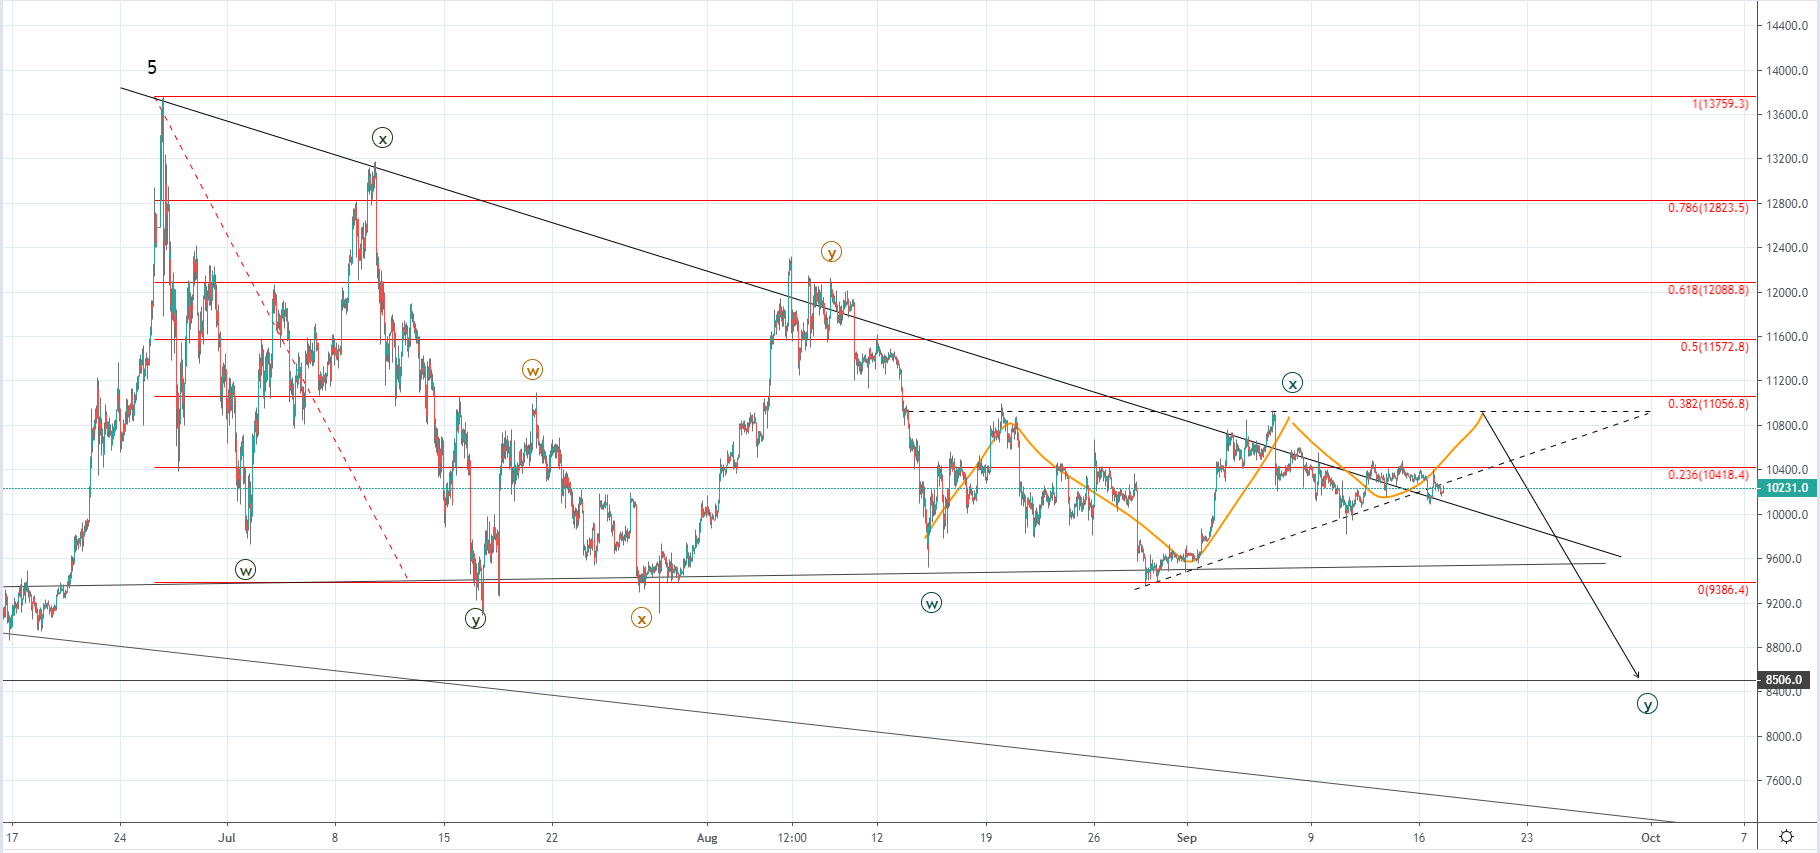
Last Monday the price of Bitcoin was sitting at around $10446 level which was an interaction with the 0.236 Fibonacci level after an attempt for a breakout from the descending triangle. As the price failed to breakout out from the triangle and instead got rejected by its horizontal resistance found slightly below the 0.382 Fibonacci level we have seen a decrease to $9985 at its lowest point last Wednesday.
From there another attempt is being made for a breakout to the upside but the price is currently stuck in a cluster between the 0.236 Fibonacci level and the triangle’s resistance which has been broken and serves as support. Currently the price is being traded at $10231 which is only 1.53% lower from yesterday’s open and with the price managing to hold above the triangle’s resistance we might see another attempt for a breakout to the upside.
Projecting the length of the W wave on to the significant horizontal resistance level slightly below the 0.382 Fib level the $8500 level comes up as the potential price target for the completion of the Y wave after which we could see the uptrend continuation as the higher degree three-wave correction would be completed.
XRP/USD
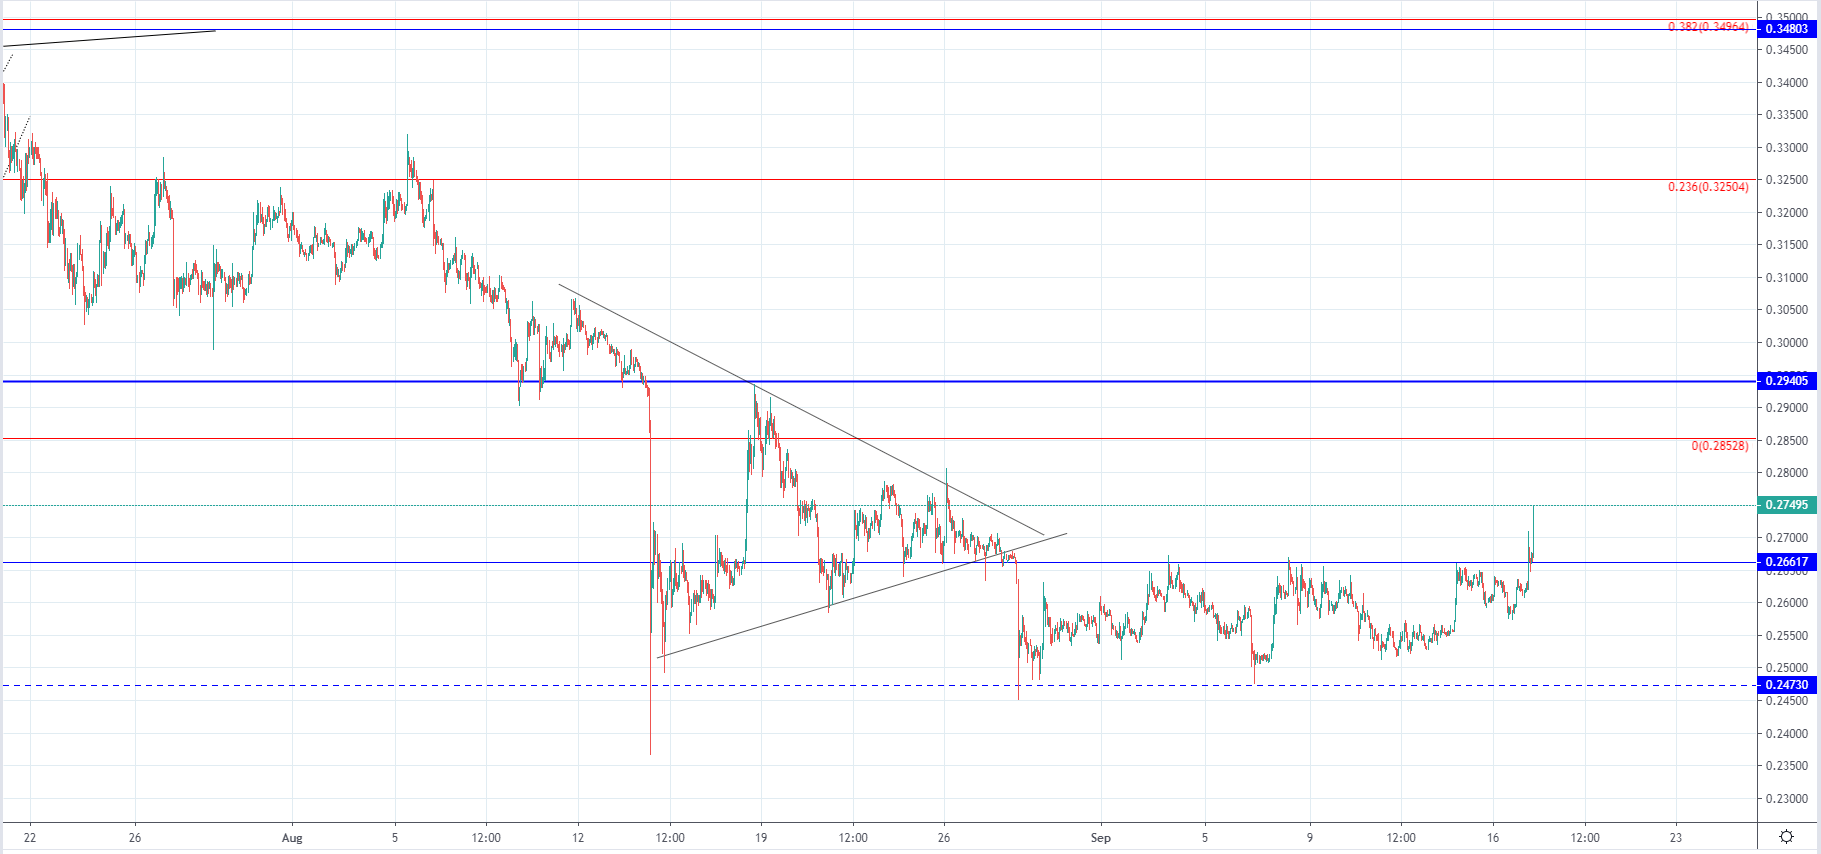
From yesterday’s low at $0.2576 the price of Ripple has increased by 6.73% as it’s currently being traded at $0.27495 and is in an upward trajectory. Last week the price of Ripple has been stuck in a horizontal range between the horizontal resistance at $0.26617 and the 0.2526 support but today we’ve seen a breakout to the upside.