


FXOpen
BTC/USD
The price of Bitcoin has attempted to break the $60,000 last week as we have mostly seen buyers’ pressure on the level throughout the week until Sunday when a decrease was made to $56,466. From there we have seen another increase followed by a higher low and now the price has made a higher high which is a bullish sign. However, it is once again back below the first horizontal level in line at $59,420 and is shortly going to make another breakout attempt.
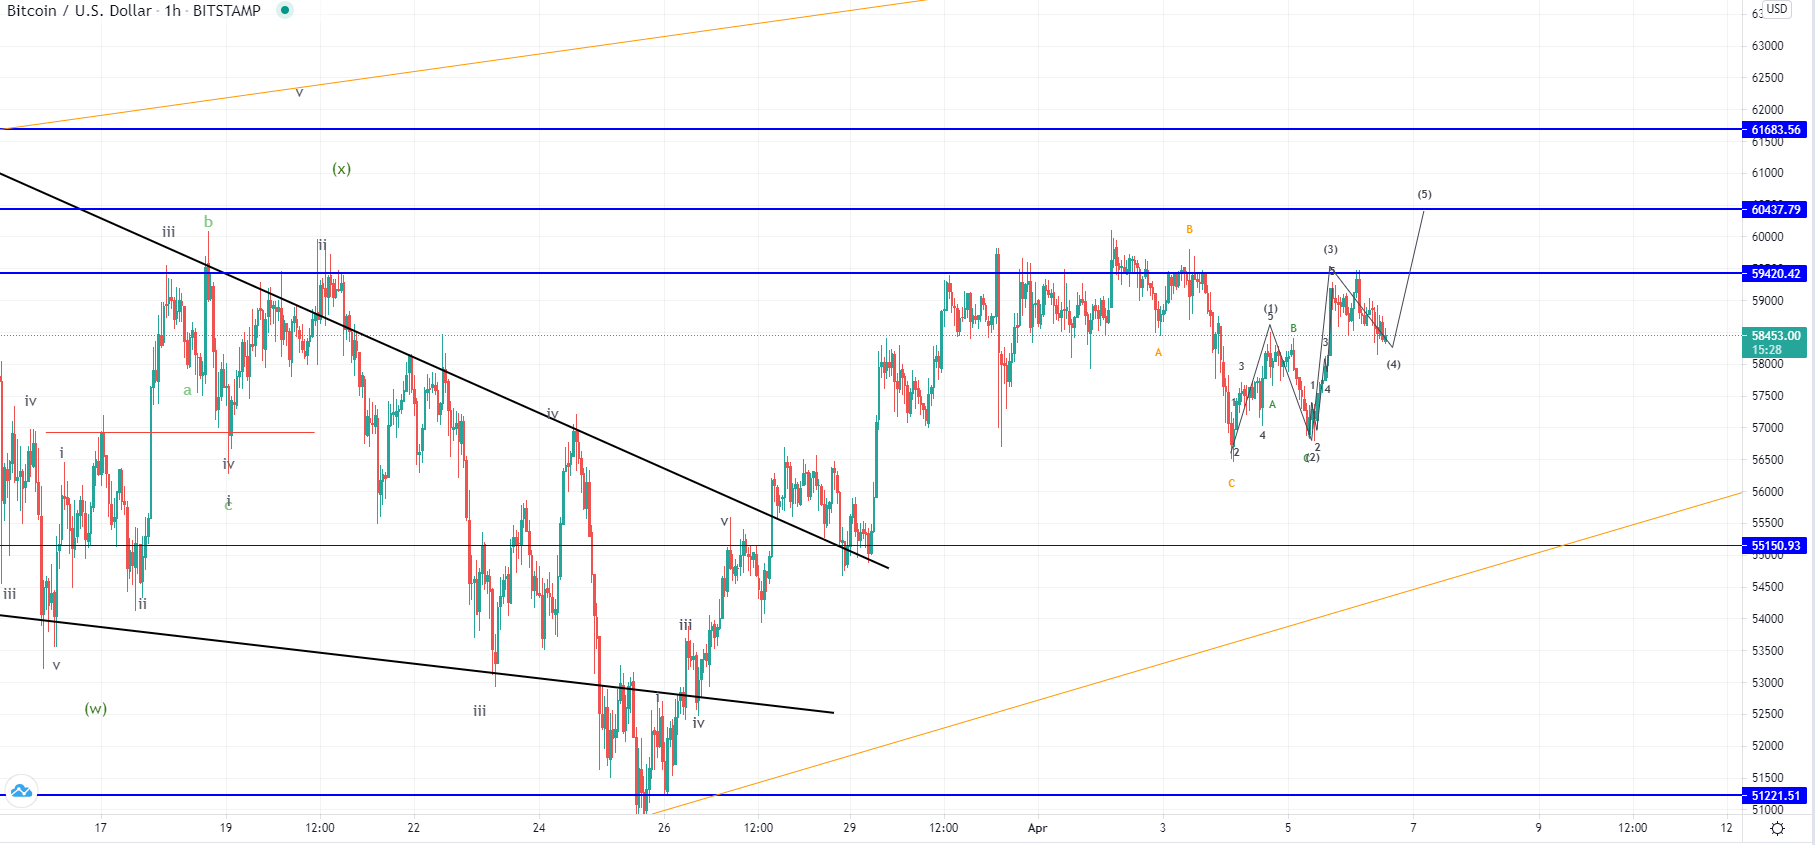
The uptrend continuation would be expected in either way but it is still unclear whether or not before it we are going to see a deeper retracement. The primary scenario is a bullish one and says that now the price has started developing a new lower degree five-wave move to the upside.
If this is true, then we are going to see another higher low for the 4th wave and potentially an interaction with the all-time high on its ending wave. But this would only be the 1st sub-wave of the higher degree count which is why new highs would be anticipated after a pullback to establish further support.
XRP/USD
The price of Ripple has been parabolically increasing from Sunday when it was sitting at $0.565 at its lowest point and made rise to $1.1 which was an appreciation of 94.3%. Currrently it is beign traded at $0.9911 as a pullback is being made.
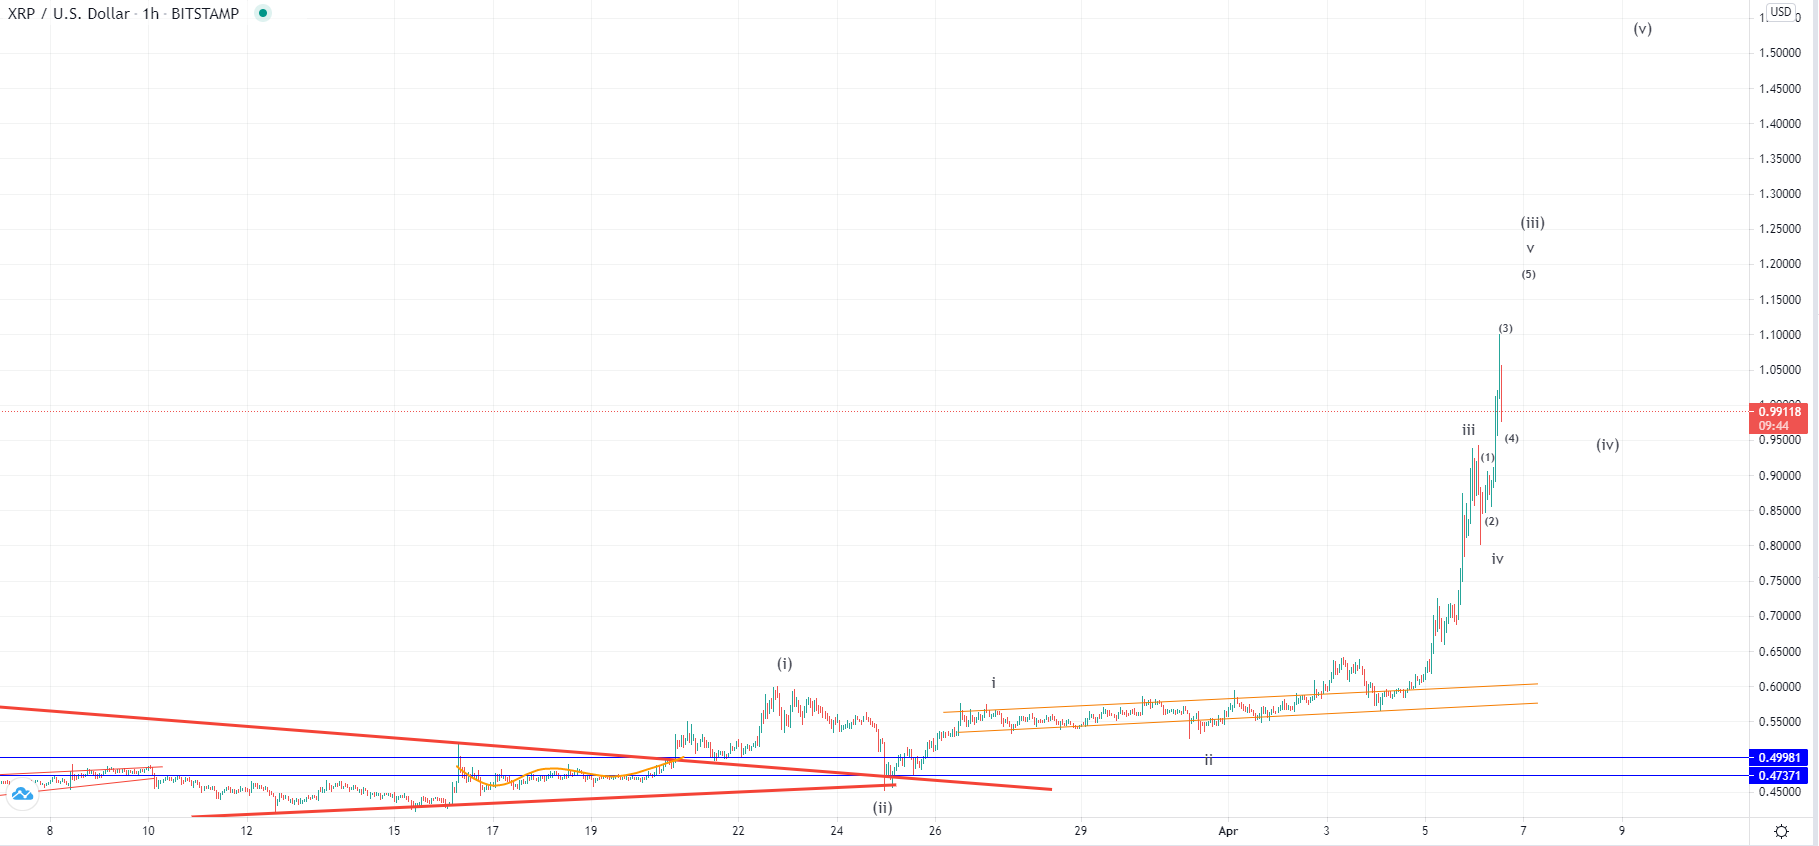
On the hourly chart, we can see that this parabolic move was the continuation of the breakout momentum from the symmetrical triangle on the 22nd of March, and after falling back to retest the broken resistance and finding support on the horizontal support at $0.473 level it consolidated throughout the ending days of March and at the start of April. We have most likely seen the development of the 3rd wave from the five-wave impulsive move to the upside.
Now it appears that the price has more room to go before the completion of the 3rd wave and would start consolidating again in a local corrective stage before another rise. An immediate uptrend, continuation could be expected to the $1.2 level where the next significant resistance zone might be enough to cause a higher degree retracement but according to the count there would still be another wave to the upside potentially surpassing $1.5
This forecast represents FXOpen Markets Limited opinion only, it should not be construed as an offer, invitation or recommendation in respect to FXOpen Markets Limited products and services or as financial advice. Cryptocurrency CFDs are not available to trade in all jurisdictions.
FXOpen offers the world's most popular cryptocurrency CFDs*, including Bitcoin and Ethereum. Floating spreads, 1:2 leverage — at your service. Open your trading account now or learn more about crypto CFD trading with FXOpen.
*Important: At FXOpen UK, Cryptocurrency trading via CFDs is only available to our Professional clients. They are not available for trading by Retail clients. To find out more information about how this may affect you, please get in touch with our team.
This article represents the opinion of the Companies operating under the FXOpen brand only. It is not to be construed as an offer, solicitation, or recommendation with respect to products and services provided by the Companies operating under the FXOpen brand, nor is it to be considered financial advice.
Stay ahead of the market!
Subscribe now to our mailing list and receive the latest market news and insights delivered directly to your inbox.


Latest articles

Trump’s Comments Spark Rally in Cannabis Stocks
Shares of cannabis-related companies have surged sharply in recent days, as what had previously been market rumours received official confirmation.
According to media reports:
→ The US President confirmed his intention to reclassify cannabis as a Schedule III substance, which would

Analytical Gold Price Predictions for 2026, 2027, and Beyond
Gold continues to attract attention as investors search for a

EUR/NZD Pulls Back From Its December High
Today the EUR/NZD rate touched the 2.4000 level — the highest reading since late November — but then saw a fairly sharp pullback. Fundamentally, the heightened volatility is driven by a combination of factors.
The euro (EUR) is showing strength