Both BTC/USD and XRP/USD under strong selling pressure
BTC/USD
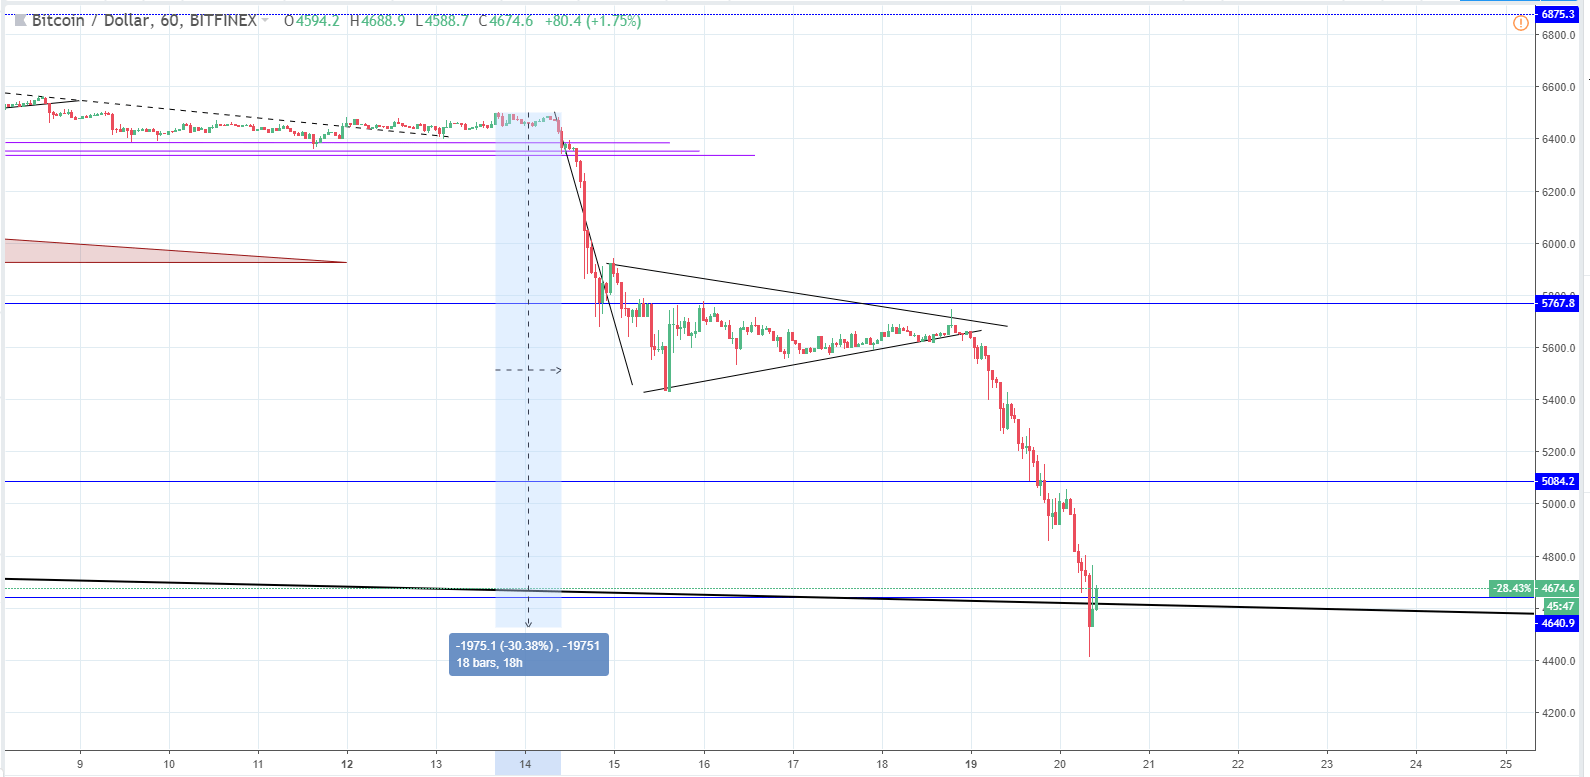
Since last Tuesday when the price of Bitcoin was around $6500 we have seen a downfall of over 30% measured to the lowest levels Bitcoin’s been today, which is at $4529.
This move to the $4700 area was expected as the price action formed a bearish pennant from which, if you were to project the length of the prior move from the apex, you would get a target at around $4700. Also, this was the target area for the descending triangle breakout seen on the daily chart below.
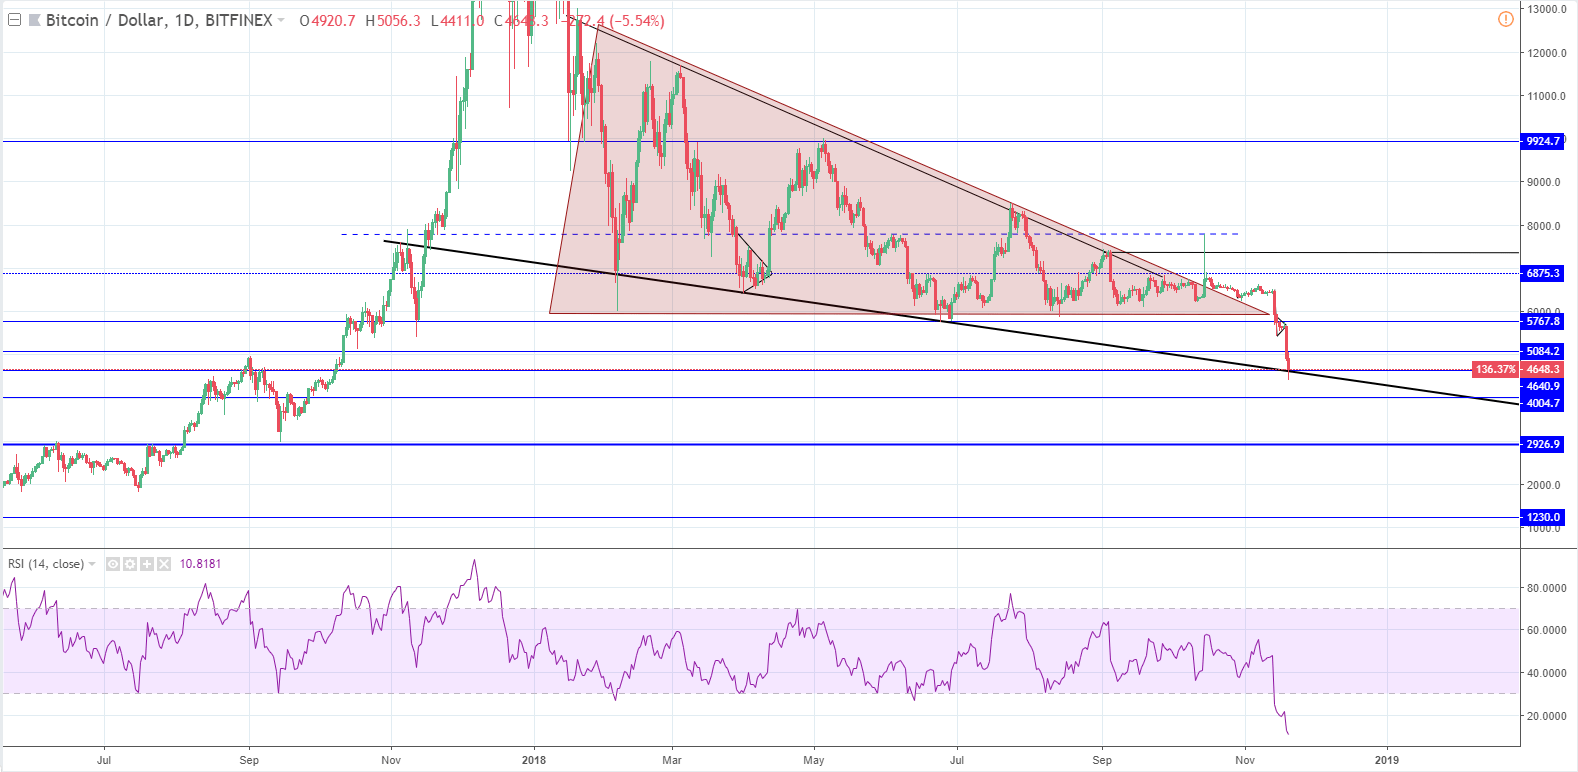
As you can see the price fell to the intersection of the horizontal support level, which served as resistance in September last year and the support from the descending structure resembling a triangle/channel. The price dipped below it today but is currently above the mentioned levels leaving a wick on the daily candle. The day is not over, so we are yet to see if today’s daily candle manages to close above it. If it does, that would be a good sign as that would indicate that some at least temporary support has been found.
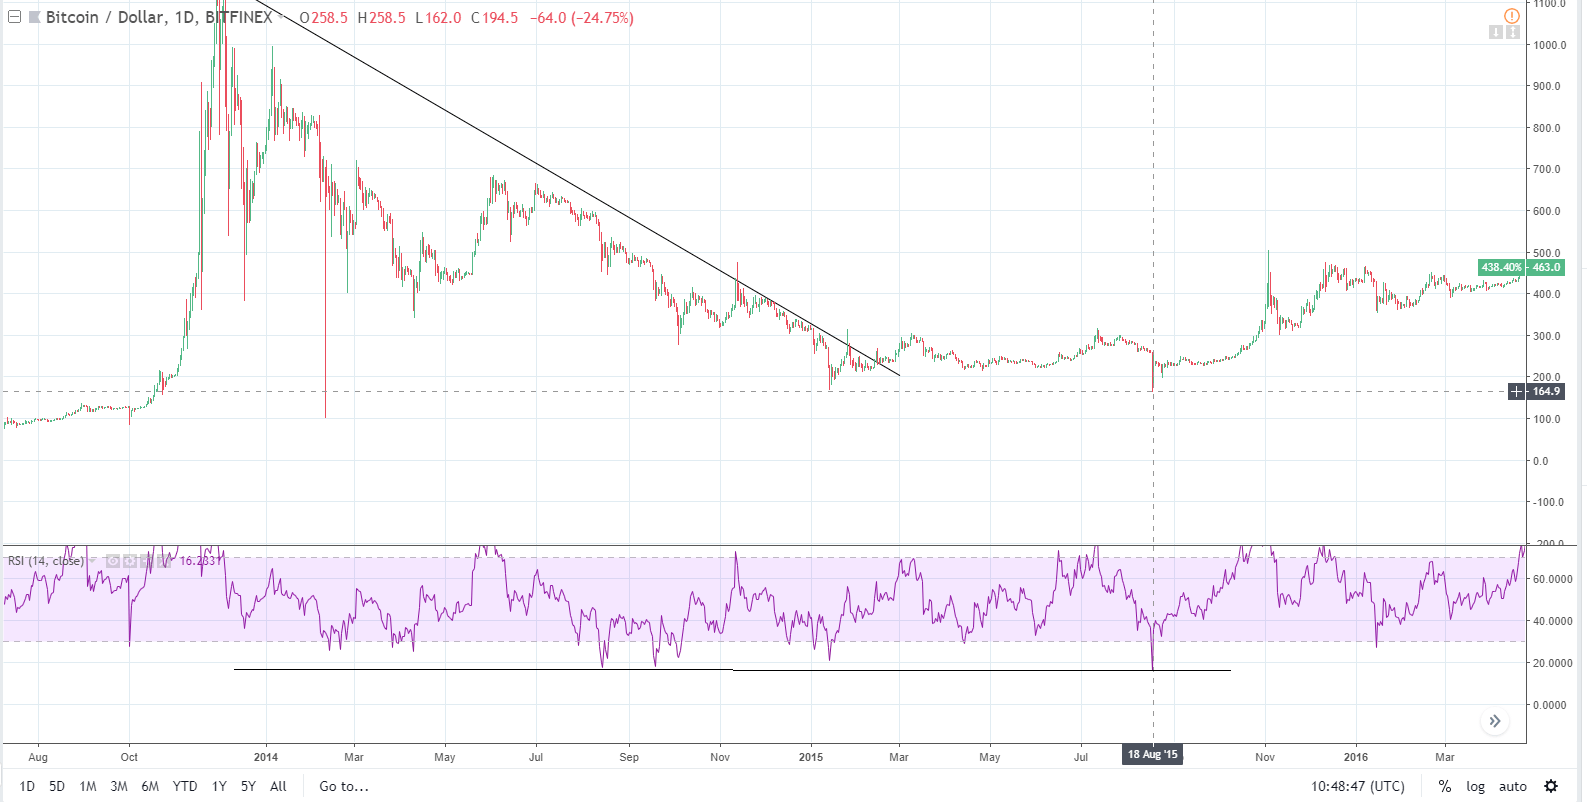
The RSI is at 10.44%, which is its all-time low so far as the RSI never went below 16.11%. It was the previous all-time low made on August 18th of 2015 when the price of Bitcoin was at $165, which was in a time after the 2014 correction ended and the market cycle was in the accumulation stage. It created a range in which the bottom has interacted with two times and the mentioned RSI level was on the second interaction.
This may indicate that the price is reaching extreme oversold conditions and that a reversal or at least a recovery is near. In the upcoming period, I would be expecting to see a short-term recovery to at least $5500 area.
XRP/USD
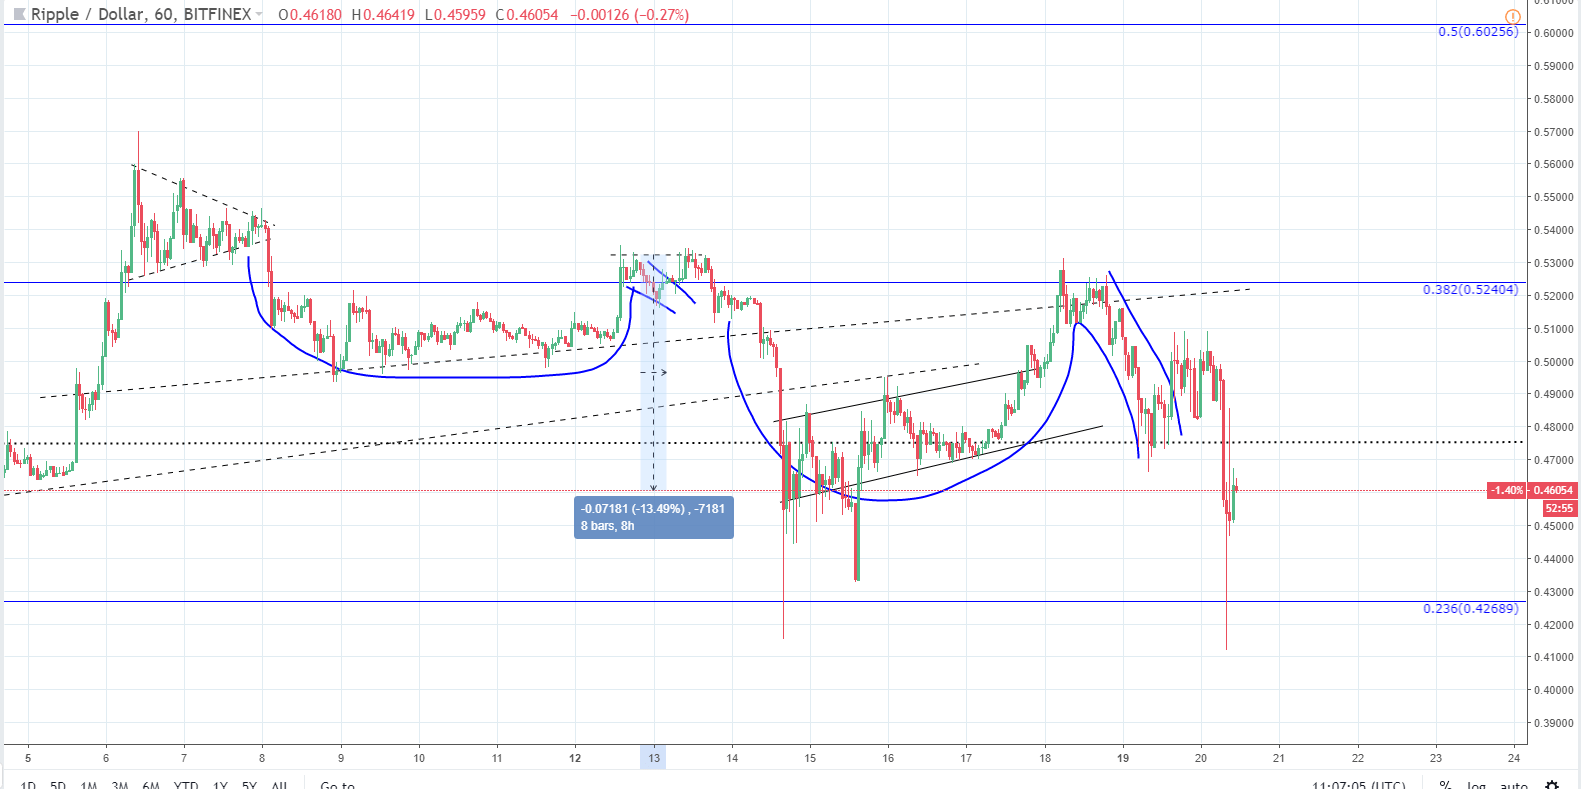
Unlike Bitcoin, the price of Ripple has fallen by 13.49% since our analysis on Tuesday – coming from $0.5324 to the current levels of $0.46.
Looking at the hourly chart, you can see that two consecutive cup and handles were formed from which in both cases the price broke out the handle from the upside at first but hasn’t managed to stay above the handles ending point, falling lower each time. But the previous breakout ended lower than the current one, if you are judging by the candle close and not the wicks. It means that some support has been found around $0.46 area.
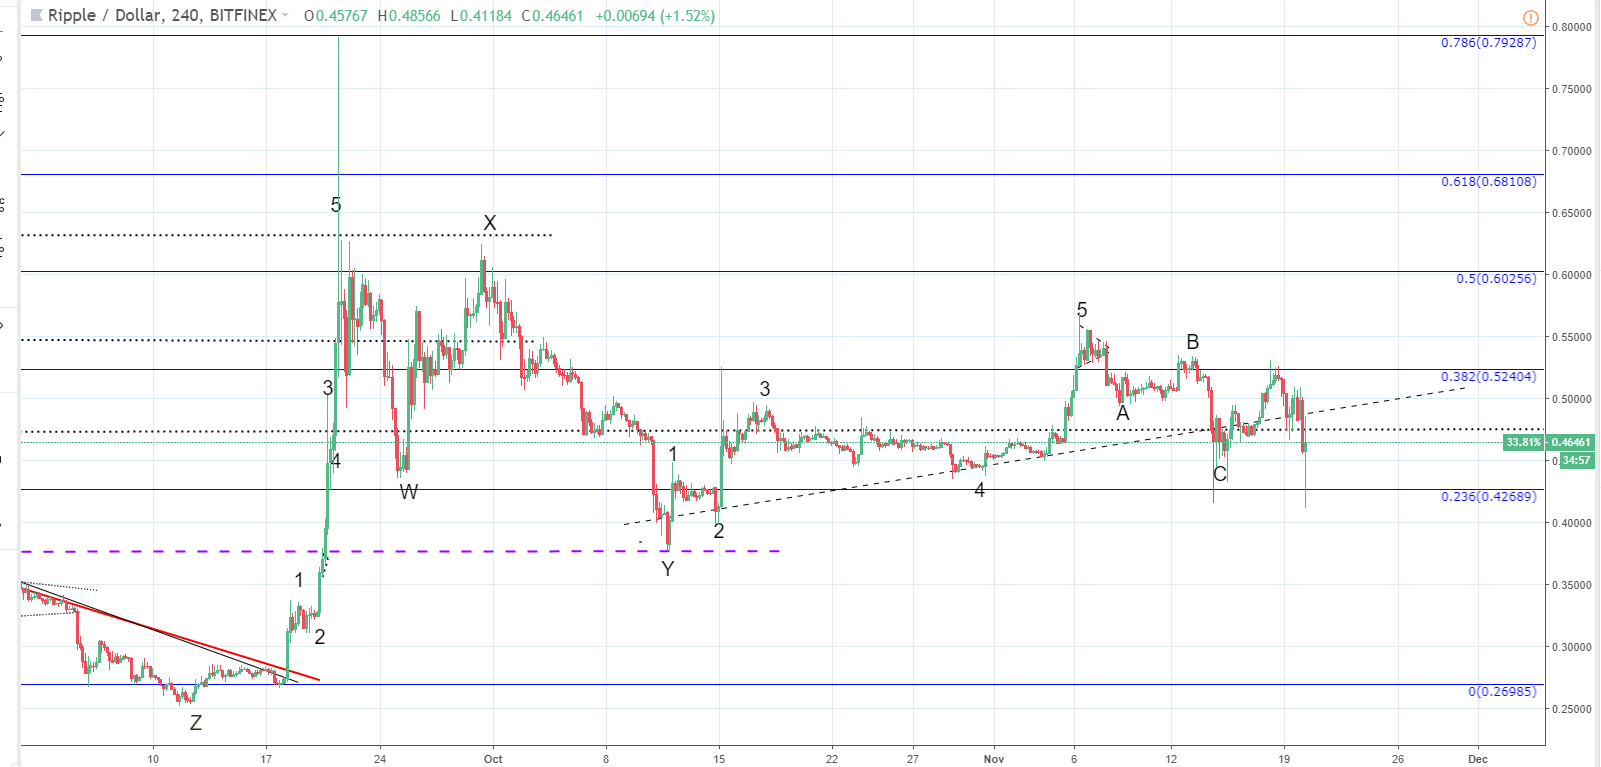
Zooming out to the 4-hour chart, you can see that the price has managed to stay above the $0.455 area for quite some time now, but the minor uptrend support line has been broken now as the correction after an impulsive 12345 is developing.
Zooming out to the daily chart, I labeled a similar chart area, which resembles the current one and this correction may end similarly.
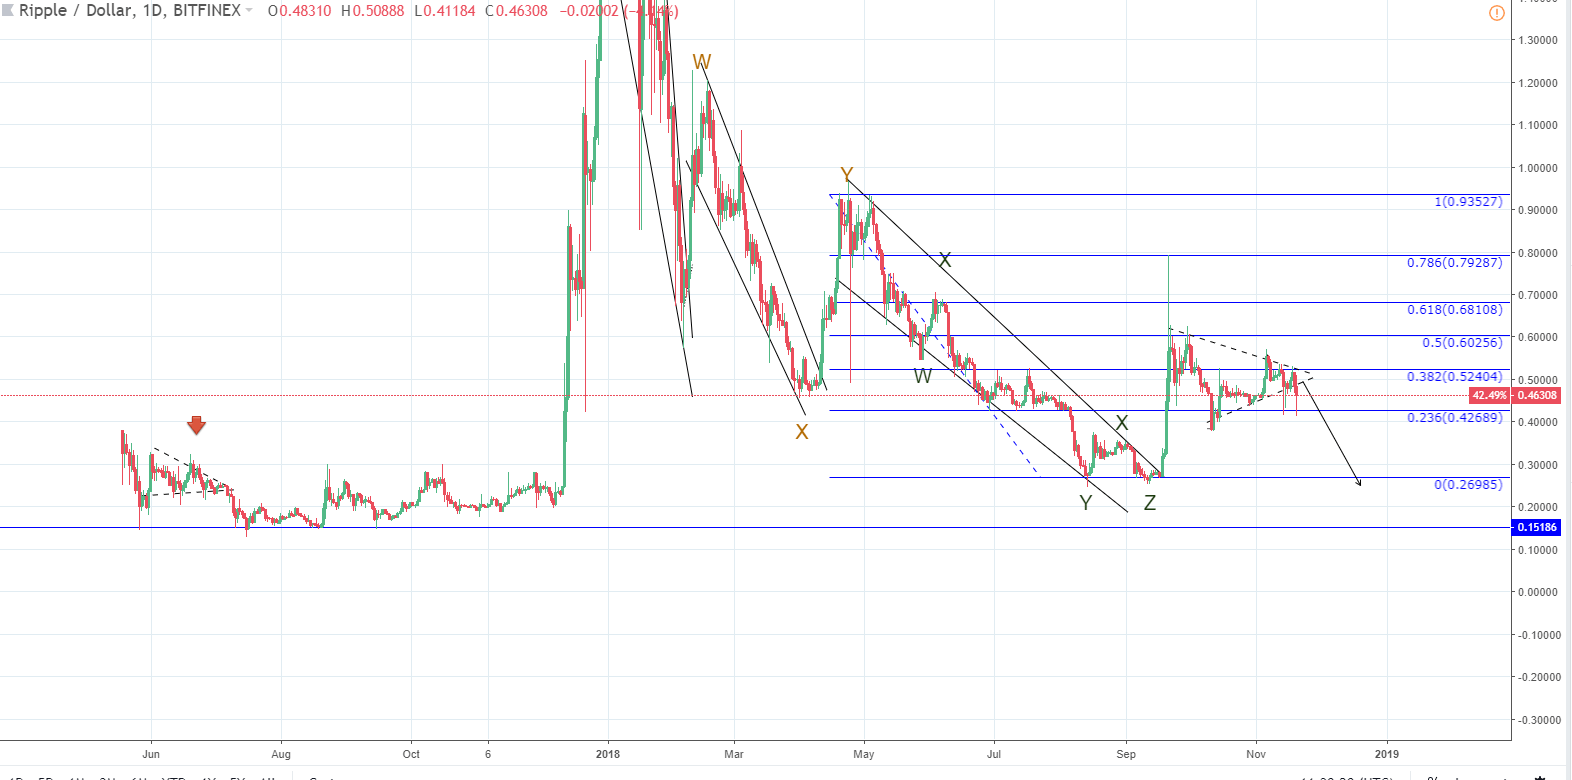
For both Bitcoin and Ripple we should expect more downside but since the prices have fallen steeply and aggressively I would first be looking at some kind of consolidation or a short-term recovery before new lows are made.