BTC/USD and XRP/USD in a sideways movement
BTC/USD
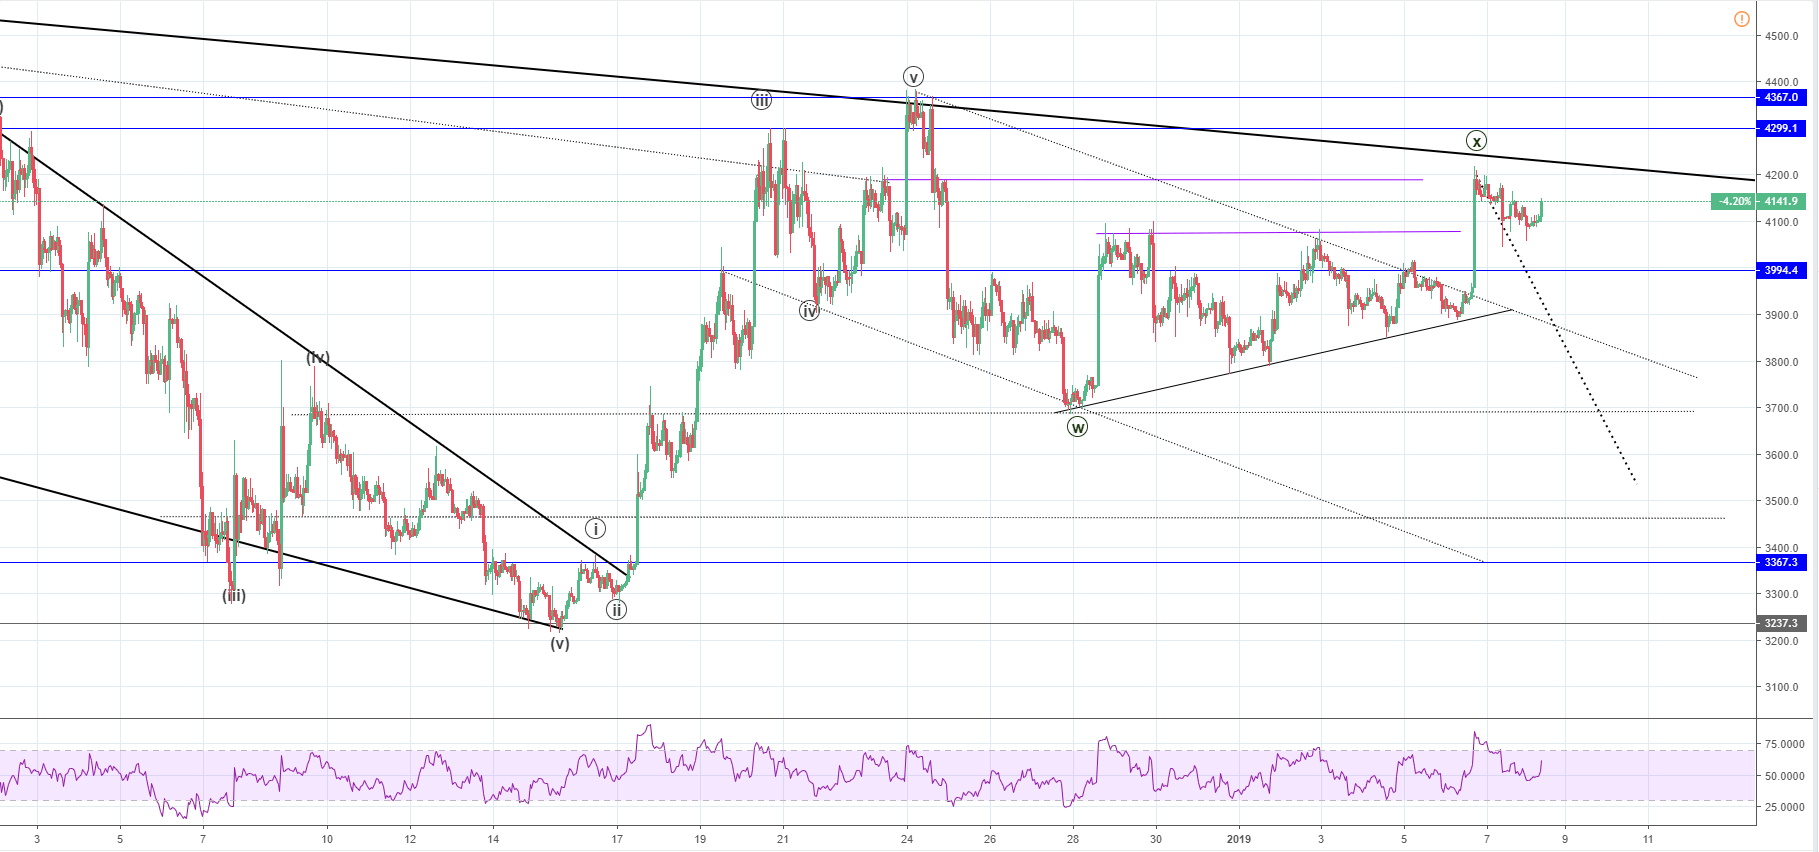
From January 1st when the price of Bitcoin was $3797 at its lowest the cryptocurrency price has increased. BTC/USD is currently trading at around $4140 which is an increase of 9%. The price went further up since the start of the year and was $4218 at its highest point so far on Sunday.
On the hourly chart, the price action has created a triangle, and the price has broken out from it on Sunday when it reached $4218 making it the yearly high so far. The BTC/USD pair broke the horizontal resistance at around $4000 as well a minor one at $4081 (the prior two highs level). The BTC price also broke the descending channel formed since the price reached the bold black line. As the cryptocurrency moved close to the black bold line, the significant downtrend support, it’s likely going to retest the level from the downside again.
The price is in an upward trajectory again. The pair is checking if the second horizontal resistance (purple line) is strong enough to withhold the momentum as it did last time when the price interacted with the level but bounced and pushed the price down for a retracement. I have labeled the current price action structure as the X wave. The second corrective wave from the WXY correction will likely develop after an impulsive move to the upside.
After it ends, a pullback is expected. The Y wave should start developing which means that more downside is expected from the current levels. According to RSI, the price strength is above mid range which means that the price could go either up or down from here. This fits perfectly with my Elliott Wave count as the expected short-term price action movement is likely going to be sideways for a while now.
Projecting the W wavelength from the current level we come up with the target price of around $3540. The price might get lower than that as it might go all the way down to the horizontal support at $3367 for a retest.
XRP/USD
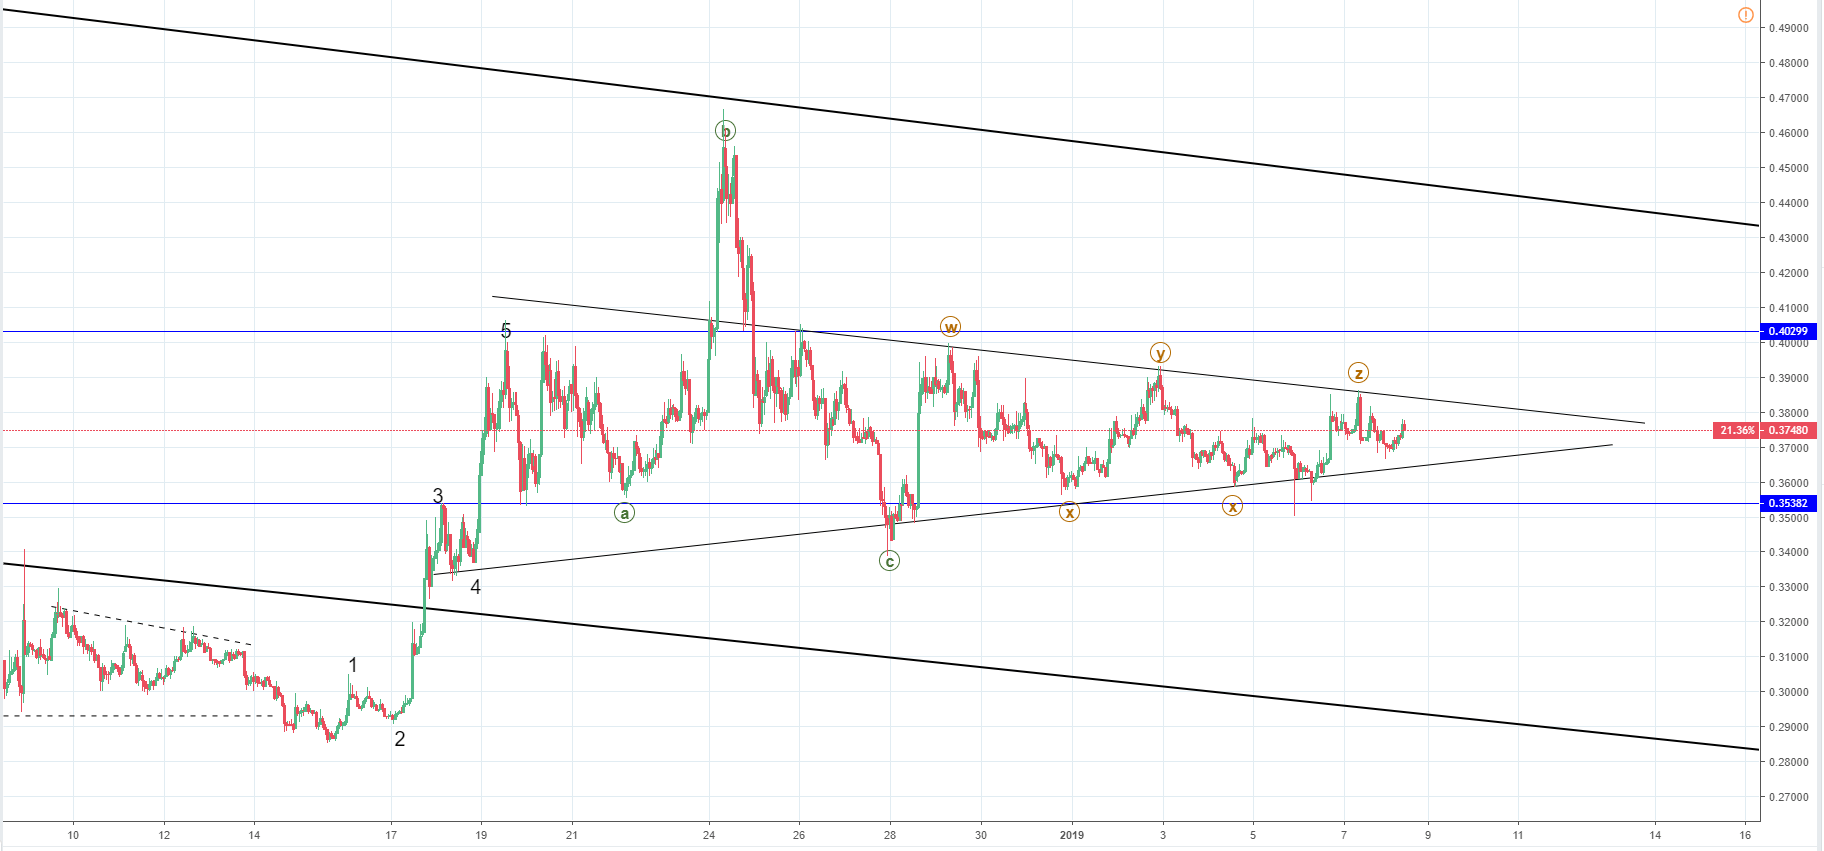
On January 1st the price of Ripple was $0.35873 at its lowest point. Since then the price was in a sideways movement and has gone up to $0.39105 at its highest point so far. Afterward, the Ripple fell to the year’s low again. This continued on for another time when the price again started increasing but it came up slightly lower than the last time, coming to $0.38418 before going down again.
The XRP/USD price is also in a descending channel since September 21st so I am looking for an interaction with the outline levels again. The current market conditions show us that we are going to see an interaction with the upper levels before another depreciation in price and further downside.
Thus, we are most likely going to see a minor retracement to the lower horizontal support level. After that, another increase is expected to the upper bold black line which is the descending channels resistance line. Then a rejection will occur and we are going to see further downside for the price of Ripple.