Technical Analysis on BTC/USD and LTC/BTC Cryptocurrency Pairs
BTC/USD analysis
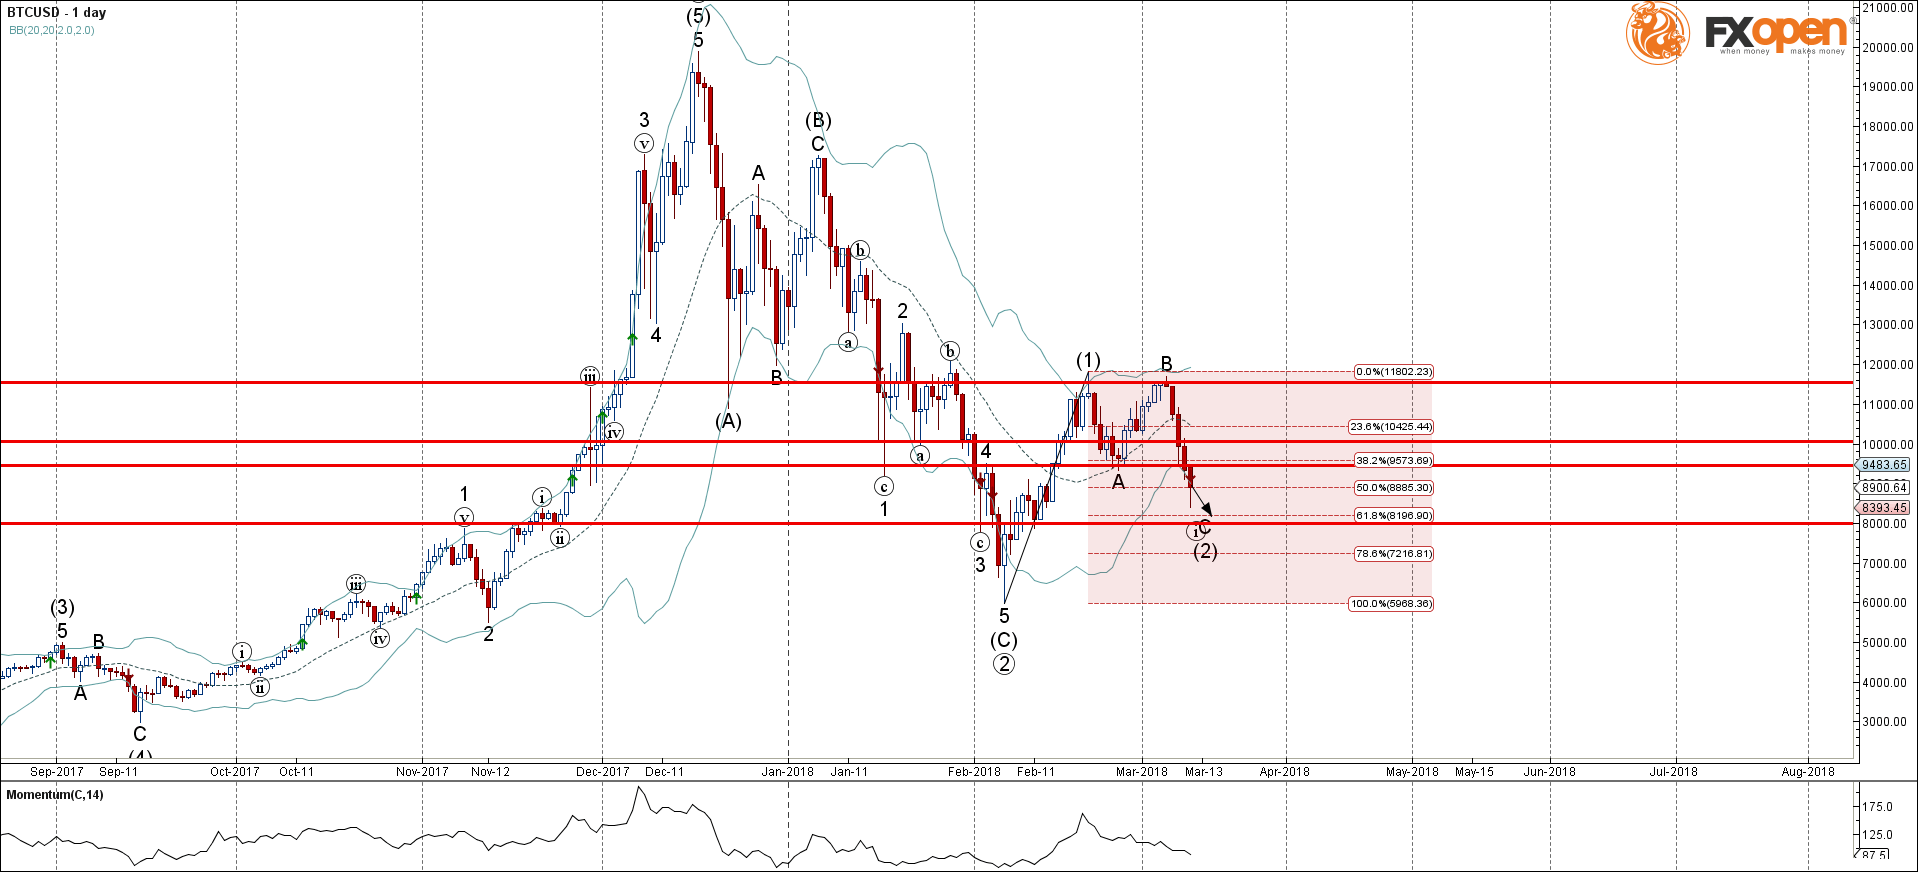
- BTC/USD broke support zone
- Next sell target – 8000.00
BTC/USD continues to decline after the earlier breakout of the support zone lying at the intersection of the following support levels: 38.2% Fibonacci retracement of the previous medium-term upward impulse (1) from February and the support level 9430.00 (which stopped the short-term A-wave of the active medium-term ABC correction (2) from middle of February. The breakout of this support zone strengthened the already strong bearish pressure on this instrument – which is indicated by the accelerating downward movement on the daily Momentum indicator.
BTC/USD is expected to continue the downward movement toward the next sell target at the round support level 8000.00 (which is the target price for the completion of the active impulse wave C).
LTC/BTC analysis
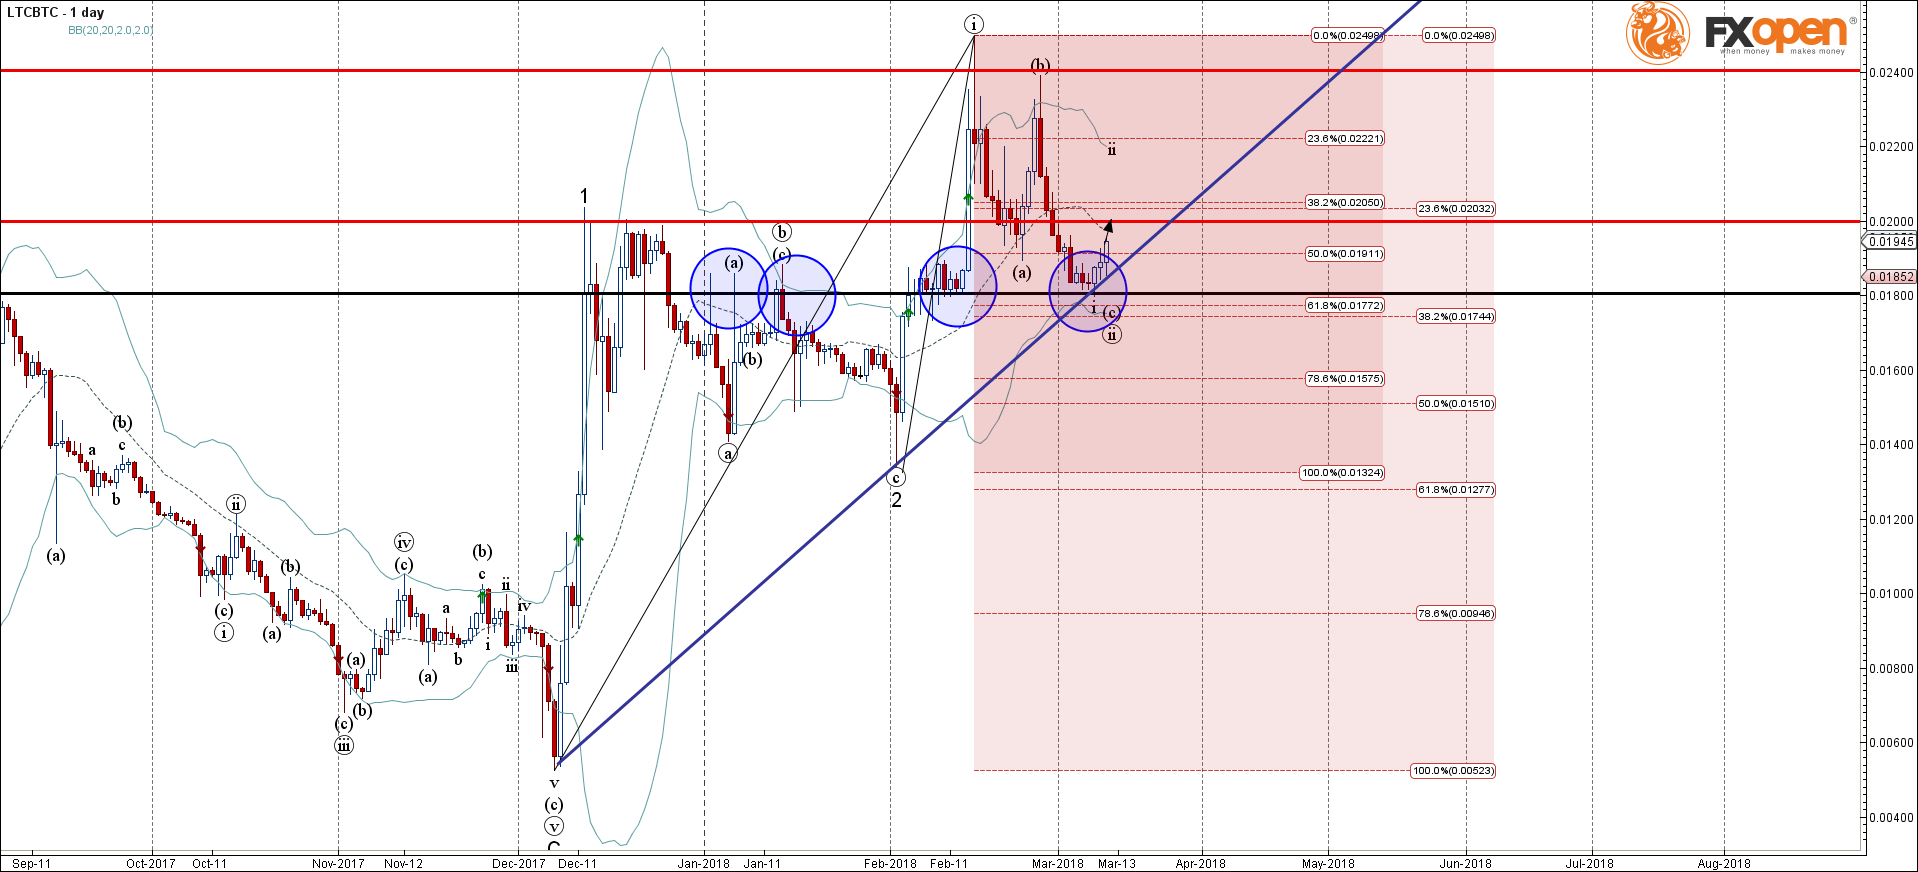
- LTC/BTC reversed from support area
- Next buy target – 0.2000
LTC/BTC recently reversed up from the support area lying at the intersection of the major support level 0.018 (former strong resistance from January, acting as support after it was broken by the previous minor impulse wave (i), as can be seen below), lower daily Bollinger Bands and the ascending support trendline from December. This support zone was further strengthened by the Fibonacci cluster made out of the 38.2% Fibonacci correction of the previous upward impulse from December and the 61.8% Fibonacci retracement of the earlier upward price impulse from February.
LTC/BTC is likely to rise further toward the next buy target at the next resistance level 0.2000 (former multi-month resistance level from December which stopped the earlier minor correction (a) in February).
Open a Crypto account with FXOpen broker.
By: Dima Chernovolov