


How to Trade with a Bollinger Bands Indicator
FXOpen
Bollinger Bands are a technical analysis tool widely used by traders worldwide. It’s a volume indicator. Although volume indicators don’t usually provide entry and exit signals, Bollinger Bands do. This FXOpen guide will provide a Bollinger Bands definition and explain how to read and use its signals when trading.
What Is a Bollinger Bands Indicator?
The Bollinger Bands indicator was developed by John Bollinger in the early 1980s. Despite a common concept that volatility is static, Mr. Bollinger believed that it was dynamic. He needed a tool that would adapt trading bands and volatility. Although the indicator was created for securities analysis, traders use it widely in different markets, including forex, stocks, commodities, and cryptocurrencies*.
The indicator consists of three lines. The middle Bollinger Band is a simple moving average, while the upper and lower bands stand for market volatility and are calculated based on the moving average and a standard deviation. The deviation determines how far the price value is from its average.
When implementing the indicator in the chart, traders can set two parameters – period and standard deviation. The former determines how many periods are considered for the indicator calculation, while the latter stands for the distance between the bands.
How to Calculate Bollinger Bands
Although you don’t need to calculate the indicator manually, it’s worth knowing how it’s built.
The middle Bollinger Band is a moving average calculated on the close price. The standard period is 20 but can be changed depending on the market conditions and timeframe. Usually, the period is increased in charts with a longer period and is cut in charts with a shorter one. The standard deviation is typically 2 but this can also be changed. As it determines the distance between bands, it can be increased to smooth the noise in a highly volatile market.
Bollinger Bands formula is simple:
- Upper Band = 20-period SMA + (20-period standard deviation of price * 2)
- Lower Band = 20-period SMA - (20-period standard deviation of price * 2)
How to Use Bollinger Bands
Aside from volatility, the indicator reflects entry and exit points and determines price direction.
Volatility
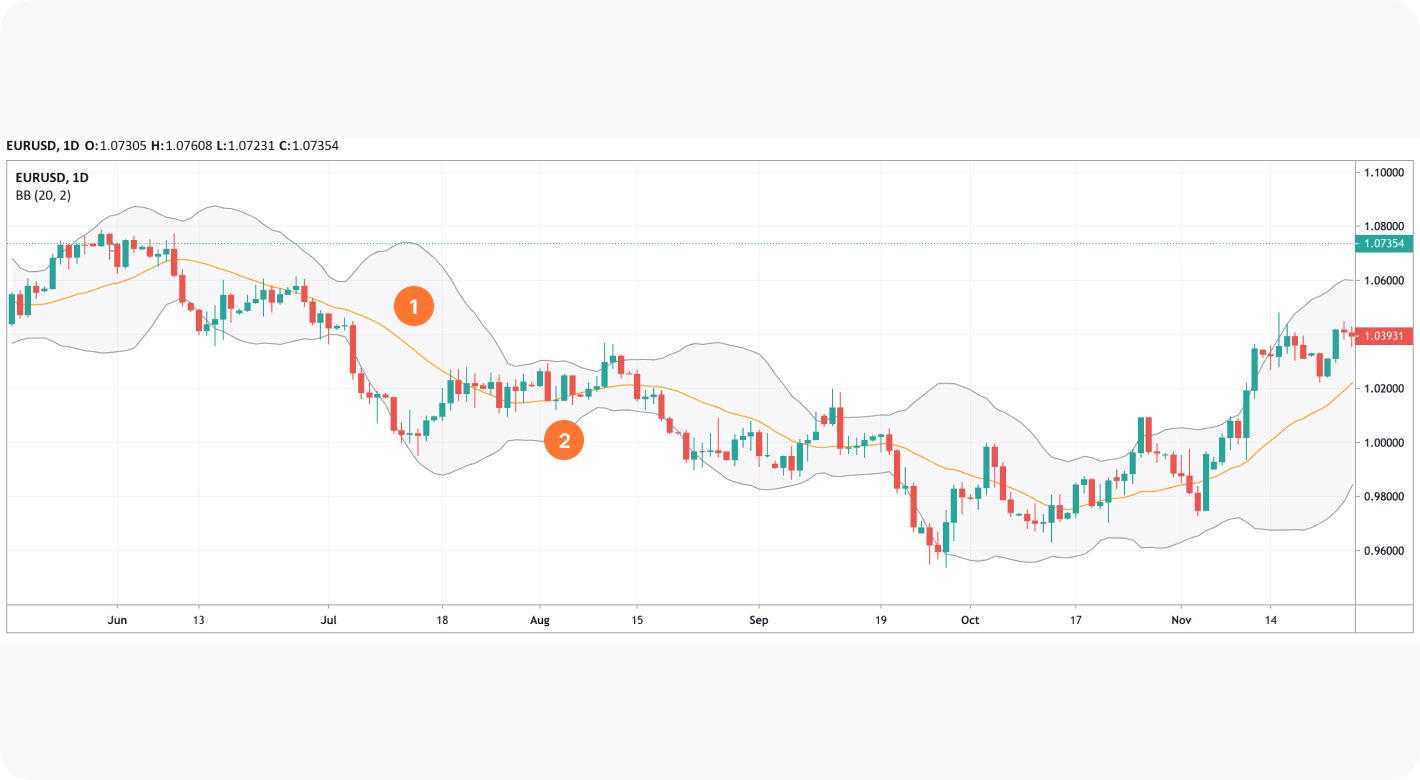
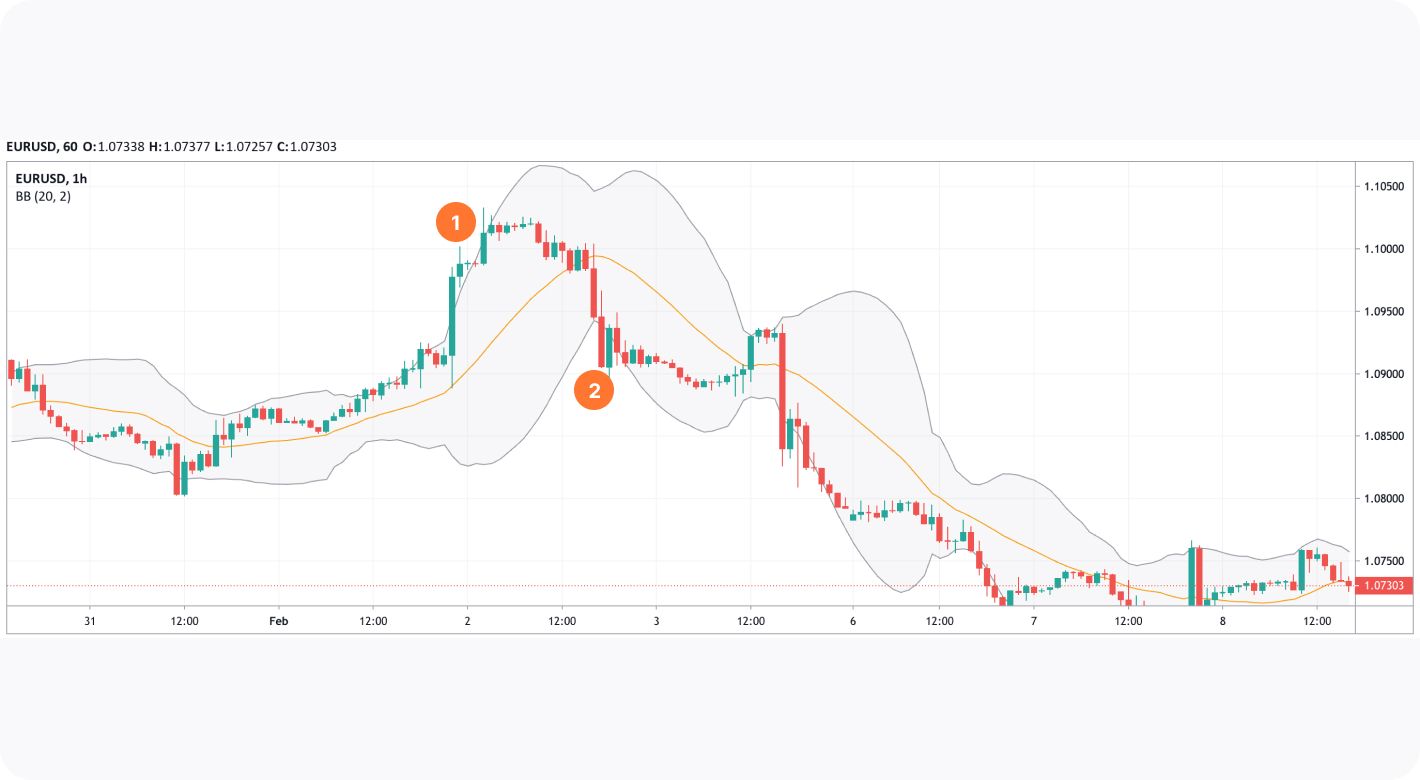
The primary indicator’s signal is volatility. All three Bollinger lines are dynamic, so they widen and narrow. In periods of increased volatility, bands move away from the middle line (1). Conversely, when the market is calm, bands move closer to the middle line (2).
When the indicator reflects low volatility, traders expect the price to gain momentum in the near future. Although it doesn’t indicate whether the trend will reverse or continue, traders can still get a clue about the price direction.
Price Direction
The theory says that buyers prevail in the market when the price rises above the middle line; when the price falls below the middle line, sellers take control of the market. It doesn’t mean that a fall below the middle line will form a strong downtrend, but the price is expected to fall for at least some time.
Entry and Exit Points
As the price is supposed to bounce from the upper to the lower line and vice versa, a trader can use this feature to enter the market. Once the price rebounds from the lower line, the upper will become a target; if the price bounces off the upper line, the lower will be a target. However, it’s worth remembering that it may take time to reach the opposite line. Therefore, in a conservative approach, a trader will wait for the price to break the middle line. This is a kind of confirmation.
Still, this strategy can limit your potential rewards.
When implementing a riskier technique, a trader enters a market once the price rebounds from the band. However, this method works in a ranging market and on high timeframes. Also, it’s vital to evaluate market conditions before opening a trade.
Usually, all three signals are combined and used in one trading strategy.
Bollinger Bands Trading Explained
Let’s consider two examples of potential trades.
Strategy #1
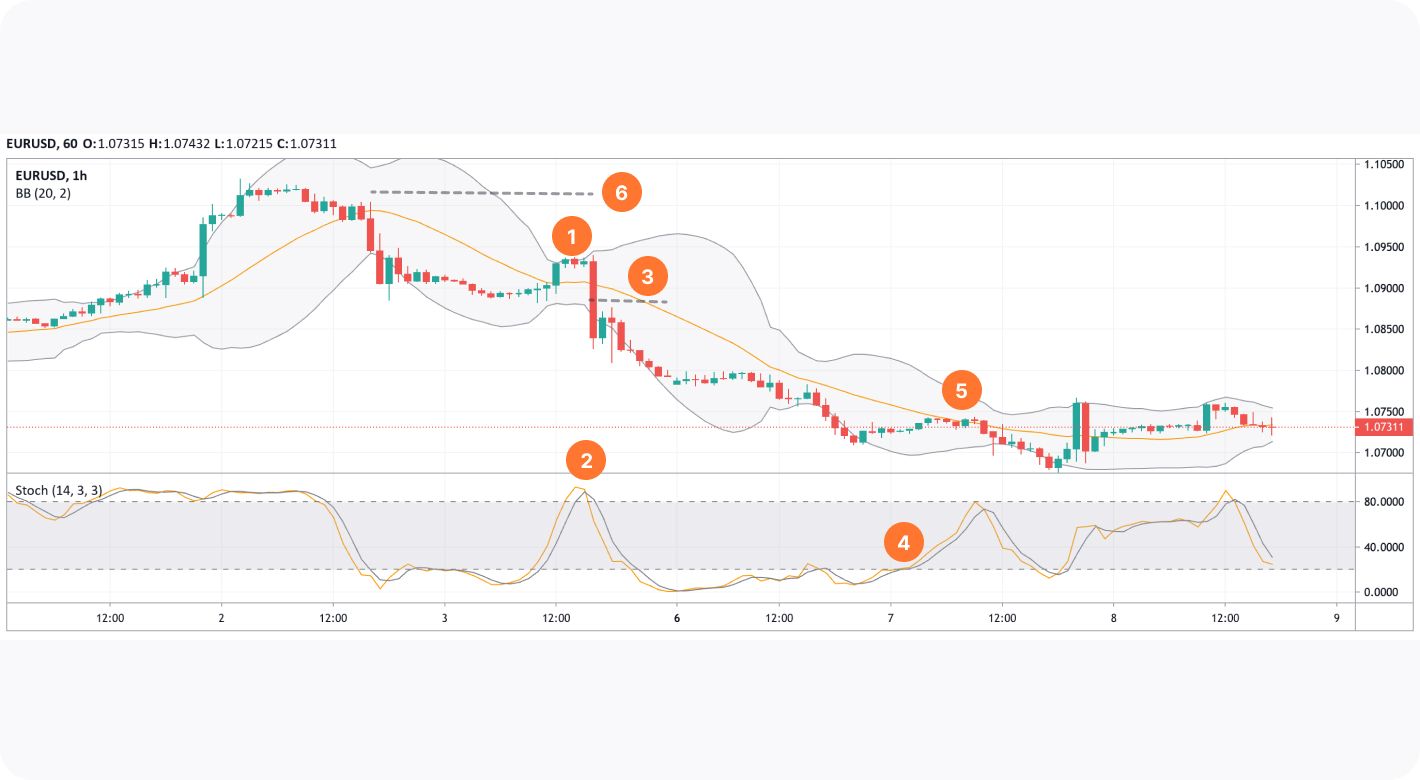
The EUR/USD pair was trading in a downtrend. When the Bollinger Bands narrowed, a trader would have expected the price to gain momentum in the near future. As the overall trend was bearish and the price was near the upper Bollinger Band (1), a decline would have likely occurred. At the same time, the stochastic oscillator was in the overbought area (2), which was another alert of a potential drop in price. A trader could have gone short once the price fell below the middle line (3).
The take-profit target would depend on the trader's approach. First, they could have waited for the stochastic oscillator to leave the oversold area (4). Another possibility was to exit the market once the price touched the middle line again (5). As for the stop-loss order, the trader could have placed it slightly above the highs before the price moved below the middle line (6).
Strategy #2
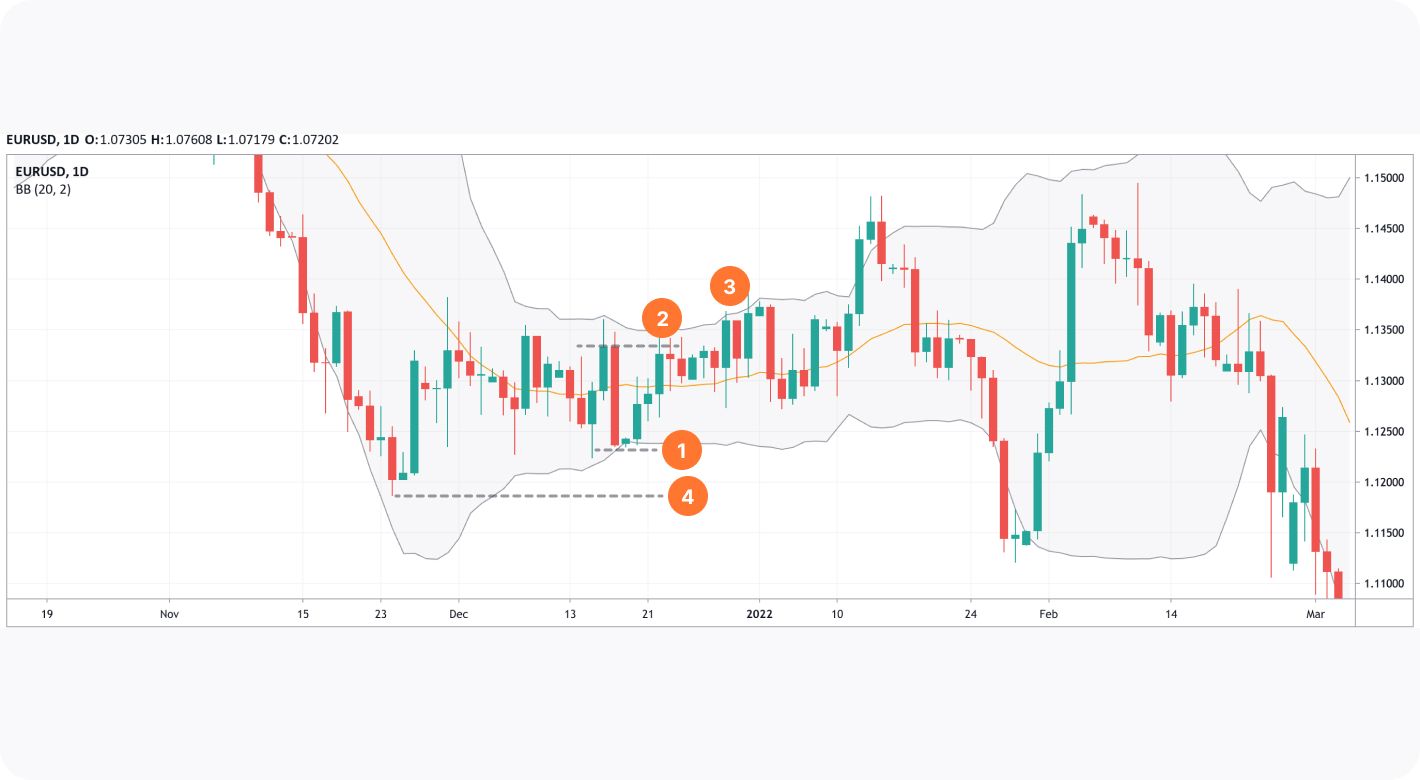
The second way to trade with the Bollinger Bands is range trading. In the chart above, the price moves in a narrow range, and the indicator reflects low volatility. A trader could open a buy trade at point 1. Their target would depend on the current market conditions. First, the trader could place a take-profit level at the closest resistance level (2). Another opportunity would be to wait for the price to reach the upper band (3), as the theory suggests that the price moves from one band to another. However, as it’s a daily chart and the trader can’t control the market constantly, such an approach might lead to losses. A stop-loss level could be calculated with a risk/reward ratio of 1:2 or 1:3, or the trader could place it slightly below the recent price lows (4).
Note: as with any other indicator based on the moving average, Bollinger Bands provide delayed signals. On the one hand, it’s beneficial for traders because they receive a confirmed signal. On the other hand, it may cause a trader to miss an effective entry point when trading in charts of low timeframes.
These are just some of the methods for using Bollinger Bands. You can try the TickTrader platform to develop other strategies and adjust the indicator to your trading approach.
Special Consideration
A price constantly moves beyond bands. Therefore, traders are cautious when entering the market. They open a position only after a chart pattern or another technical analysis indicator confirms a specific price movement.
In the chart above, the price moved beyond the upper band but soon reversed, and a solid downtrend began (1). Later, it moved below the lower band (2), but the downtrend continued. This reaffirms the thesis that signals must be confirmed.
When trading with the Bollinger Bands, traders use oscillators that reflect overbought and oversold conditions, e.g., the relative strength index and the stochastic. Also, you can implement two moving averages with different periods and use their golden and death crosses to confirm a trend reversal. Many reversal candlestick patterns forecast a trend change too.
Final Thoughts
The Bollinger Bands are one of the widely used technical analysis tools that can be implemented for stock, commodity, cryptocurrency*, and forex trading. Although their primary aim is to gauge market volatility, they can be applied to charts to define entry and exit points. Still, its signals should be taken cautiously and confirmed with other analysis tools.
*At FXOpen UK, Cryptocurrency CFDs are only available for trading by those clients categorised as Professional clients under FCA Rules. They are not available for trading by Retail clients.
This article represents the opinion of the Companies operating under the FXOpen brand only. It is not to be construed as an offer, solicitation, or recommendation with respect to products and services provided by the Companies operating under the FXOpen brand, nor is it to be considered financial advice.
Stay ahead of the market!
Subscribe now to our mailing list and receive the latest market news and insights delivered directly to your inbox.


Latest articles

Weekly Market Insights with Gary Thomson: The Week of Central Banks and Earnings
In this video, we’ll explore the key economic events and market trends, shaping the financial landscape. Get ready for insights into financial markets to help you navigate the week ahead. Let’s dive in!
In this episode of Market

Intel at a Crossroads: Earnings Beat Meets Technical Resistance
Intel has just delivered its strongest quarter in over fifteen years, and the market reaction says it all. Q2 2026 revenue surged 25% year-over-year to $16.1 billion, crushing the consensus estimate of $14.42 billion, while adjusted EPS of

Tesla: Complex Range Structure Breaks Down Following Quarterly Earnings
Tesla released its Q2 2026 results after the market closed on 22 July. Revenue increased 26% year-on-year to $28.24 billion, while vehicle deliveries reached a record 480,126 units. However, operating margin fell sharply to 1.4%, down from