


FXOpen
Canadian Dollar/Japanese Yen (CAD/JPY) closed last week with a classic shooting start candle on the daily chart, indicating potential bearish reversal.
Technical Analysis
The pair closed last week at 94.02, well below the 50% fib level resistance, 100 Daily Moving Average (DMA) and 200 DMA. The price is expected to face huge hurdle near the 94.80-95.00 resistance area, a break and daily closing above the 95.00 handle could push the pair again into stronger bullish momentum, validating a rally above the 98.00 milestone in medium term.
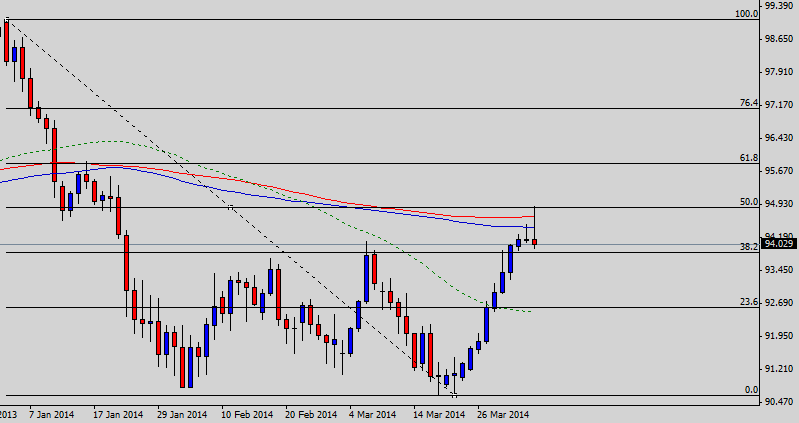
On the downside, the pair is likely to find support around 93.83, the 38.2% fib level, ahead of 92.57 that is the 55 DMA and 23.6% fib level. The short term bias will remain bullish as far as the price remains above 90.60 as per swing analysis.
Canadian Employment Reports
On Friday, Statistics Canada revealed that the unemployment rate in Canada ticked down to 6.9% in March as compared to 7.0% in the month before, analysts had predicted a steady reading of 7.0% hence the data upbeat the expectations. CAD/JPY fell despite the upbeat Canadian report which shows some serious selling pressure.
BoJ Monetary Policy
On Tuesday, April 08, the Bank of Japan (BoJ) is going to release the monetary policy statement and interest rate decision. According to the forecast of economists, the central bank is expected to keep the monetary policy unchanged, thus the Japanese Yen (JPY) might show relief rally consequently accelerating the bearish pressure on CAD/JPY.
Conclusion
CAD/JPY is expected to take retracement from the current levels. The pair might fell as low as 92.60. So selling the pair with a stop loss at the high of the shooting star could be a good strategy. The target might be around 92.60.
Trade over 50 forex markets 24 hours a day with FXOpen. Take advantage of low commissions, deep liquidity, and spreads from 0.0 pips. Open your FXOpen account now or learn more about trading forex with FXOpen.
This article represents the opinion of the Companies operating under the FXOpen brand only. It is not to be construed as an offer, solicitation, or recommendation with respect to products and services provided by the Companies operating under the FXOpen brand, nor is it to be considered financial advice.
Stay ahead of the market!
Subscribe now to our mailing list and receive the latest market news and insights delivered directly to your inbox.

Latest from Forex Analysis
Latest articles

Weekly Market Wrap With Gary Thomson: Nasdaq, EUR/USD, USD/CHF, Brent Crude Oil, Googl Shares
Get the latest scoop on the week's hottest headlines, all in one convenient video. Join Gary Thomson, the COO of FXOpen UK, as he breaks down the most significant news reports and shares his expert insights.
- Nasdaq Composite: Worst Session

Analysis of AUD/USD: Exchange Rate Falls to Early May Low
As indicated by the 4-hour AUD/USD chart today:
→ the rate fell below 0.652, a level last seen on May 2;
→ the RSI indicator dropped below 15, a level last seen during the panic over the spread of COVID-19

Analysis of AMZN Stock: Price at 1.5-Month Low
As shown in the AMZN chart, the stock price dropped below:
→ the psychological level of $180;
→ the mid-June interim low.
The last time AMZN traded below $180 was in early June.
Thus, AMZN has faced sell-offs, similar to other tech