


Choosing the Right Timeframe for Day Trading
FXOpen

In the fast-moving realm of financial markets, comprehending and evaluating price fluctuations is imperative for achieving success in trading. Technical analysis centres on delving into historical market data, primarily focusing on price and volume, to anticipate future shifts. In the domain of technical analysis, the examination of timeframes assumes a pivotal role, furnishing traders with invaluable insights into market dynamics and the identification of trends. This article aims to delve into optimal time periods for intraday trading and illuminate the utilisation of multiple timeframes.
What Is a Day Trading Timeframe?
A timeframe denotes the trading duration symbolised by each candlestick or bar on a price chart. It signifies the length of time encompassed within a single data point, such as 1 minute, 5 minutes, 15 minutes, and so forth. Timeframes hold paramount importance for traders, as they present diverse vantage points of market movements and enable a meticulous analysis of price behaviour across varying levels of granularity.
Day Trading Timeframes
Here are the best chart timeframes for day trading:
- 1-Minute: Each candlestick or bar represents one minute of market activity.
- 5-Minute: Each candlestick or bar represents five minutes of market activity.
- 15-Minute: Each candlestick or bar represents fifteen minutes of market activity.
- 30-Minute: Each candlestick or bar represents thirty minutes of market activity.
- 1-Hour: Each candlestick or bar represents one hour of market activity.
These are the general timeframes you will usually meet, but you may also find other periods, e.g. 3 and 45 minutes.
Which Timeframe Is Best for Day Trading?
The optimal timeframe for day trading predominantly hinges on the trader's approach, manner, and individual inclinations. Short intervals, such as 1 minute and 5 minutes, deliver intricate and swift price action, catering well to scalping or swift trades. This kind of trading necessitates rapid decision-making and is primarily favoured by adept and engaged market players.
Conversely, extended intervals, like 15-minute or 30-minute charts, might be better suited to swing traders, enabling them to seize more comprehensive price shifts over a span of several hours. These timeframes necessitate lesser and intermittent oversight yet still entail trading within the relatively short-term spectrum.
There is no one-size-fits-all answer, and traders often experiment with different periods to find what works best for them. You may use the TickTrader platform to analyse various financial instruments in different periods.
- 1 Minute. Trading on a 1-minute chart, traders aim to make small profits from very short-term price movements. This style demands significant attention, experience, and discipline, as the frequency of trades is high.
- 5 Minutes. The 5-minute chart is also used by scalpers. It’s popular among day traders who look for quick price swings within the same session. It requires traders to be focused and place trades quickly, but they may be rewarded if they master this fast-paced style.
- 15 Minutes. Trading on a 15-minute chart provides a balance between capturing short-term price movements and having enough time for analysis and decision-making. It can suit both scalpers and swing traders who want to avoid the noise of shorter periods and prefer holding positions for a few hours.
Trading On Multiple Timeframes
Many traders use multiple timeframes simultaneously to gain a more comprehensive view of the market. This approach is often called multiple timeframe analysis (MTFA). Usually, traders use three periods. They place a trade on a medium one, consider an overall trend with strong support and resistance levels on the longest, and check potential pitfalls for entering/exiting trades on the shortest.
Example of Using Multiple Timeframes
A day trader may analyse a 1-minute chart for their trade entries and exits, but they will also look at a 15-minute chart to identify the overall trend and potential major support/resistance areas. This can provide more context for their trades and enhance their decision-making process.
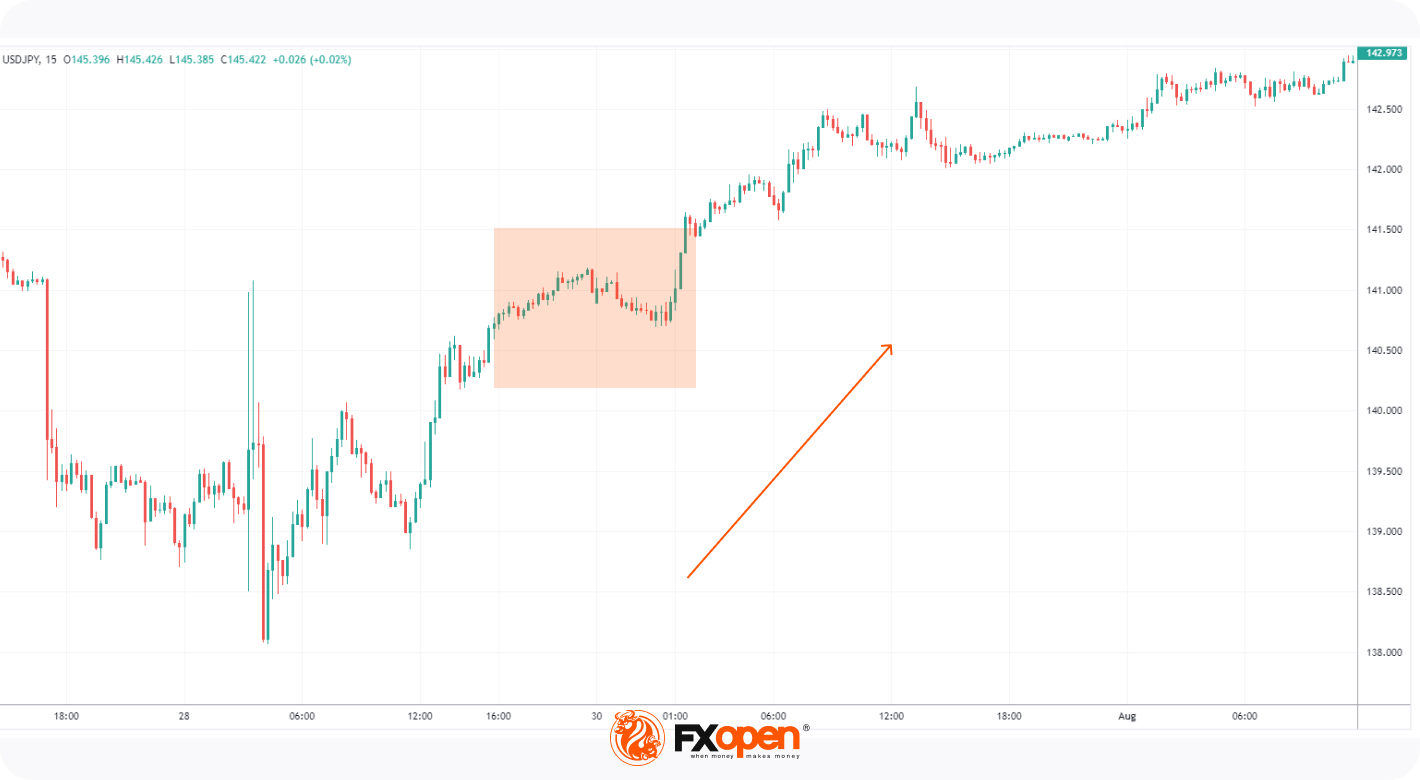
A trader observes an uptrend on the 15-minute chart of the USD/JPY pair. They mark the retracement and dive into lower periods to take an entry.
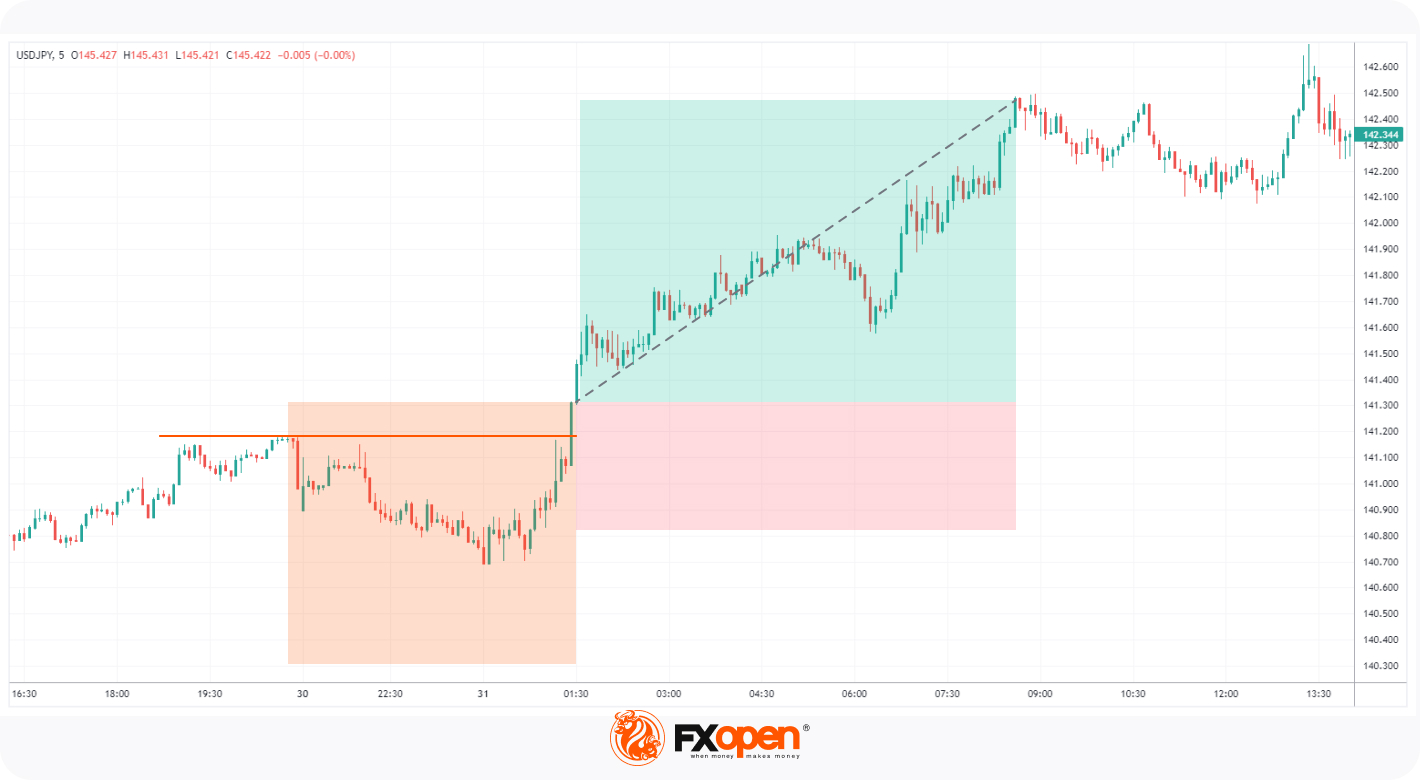
On the M5 chart, the trader notices a small resistance and waits for it to break before taking a short trade. Their take profit is at the next resistance.
Conclusion
Traders should remember that practice makes perfect in the long run. Thoroughly testing your strategy is essential to maintain consistency. Even after continuous practice, you may suffer losses as markets become choppy. A good broker with low spreads, such as FXOpen, may help you get an edge. You may open an FXOpen account and trade on a variety of CFDs with extra-fast speed.
This article represents the opinion of the Companies operating under the FXOpen brand only. It is not to be construed as an offer, solicitation, or recommendation with respect to products and services provided by the Companies operating under the FXOpen brand, nor is it to be considered financial advice.
Stay ahead of the market!
Subscribe now to our mailing list and receive the latest market news and insights delivered directly to your inbox.


Latest articles

Nasdaq 100: 48 Hours of Chaos, One Trendline Standing in the Way
Wall Street just lived through one of its wildest 48 hours of the year. On Wednesday, the Fed held rates steady at 3.50%-3.75%, but three FOMC members broke ranks to demand a hike—an unusually hawkish dissent

Amazon Analysis: Strong Earnings Coincide with a Breakout from the Correction
On 30 July, Amazon.com reported its financial results for the second quarter of 2026, significantly exceeding market expectations. Revenue rose 20% year-on-year to $200.6 billion, compared with the consensus forecast of around $196.5 billion. The main growth

GBP/USD and EUR/GBP Await Key Bank of England Decision
The pound strengthened following the outcome of the US Federal Reserve meeting, where the central bank, as expected, kept interest rates unchanged. However, the Fed did not provide the market with clear signals of an imminent shift towards rate cuts,