


What Is the Cup and Handle Pattern? Unique Features and Application
FXOpen
The cup and handle is a well-known chart pattern traders use to determine potential breakouts. It may be easy to spot, once you know what to look for, but there are plenty of variables to consider. This article breaks down how the pattern forms, what to look out for, and how traders implement it into their trading strategies.
What Is the Cup and Handle Pattern?
The cup and handle definition refers to a chart pattern that indicates a shift in market sentiment and a possible breakout. The pattern holds weight as it shows a common shift in sentiment: sellers push the price down early on, and then buyers regain control.
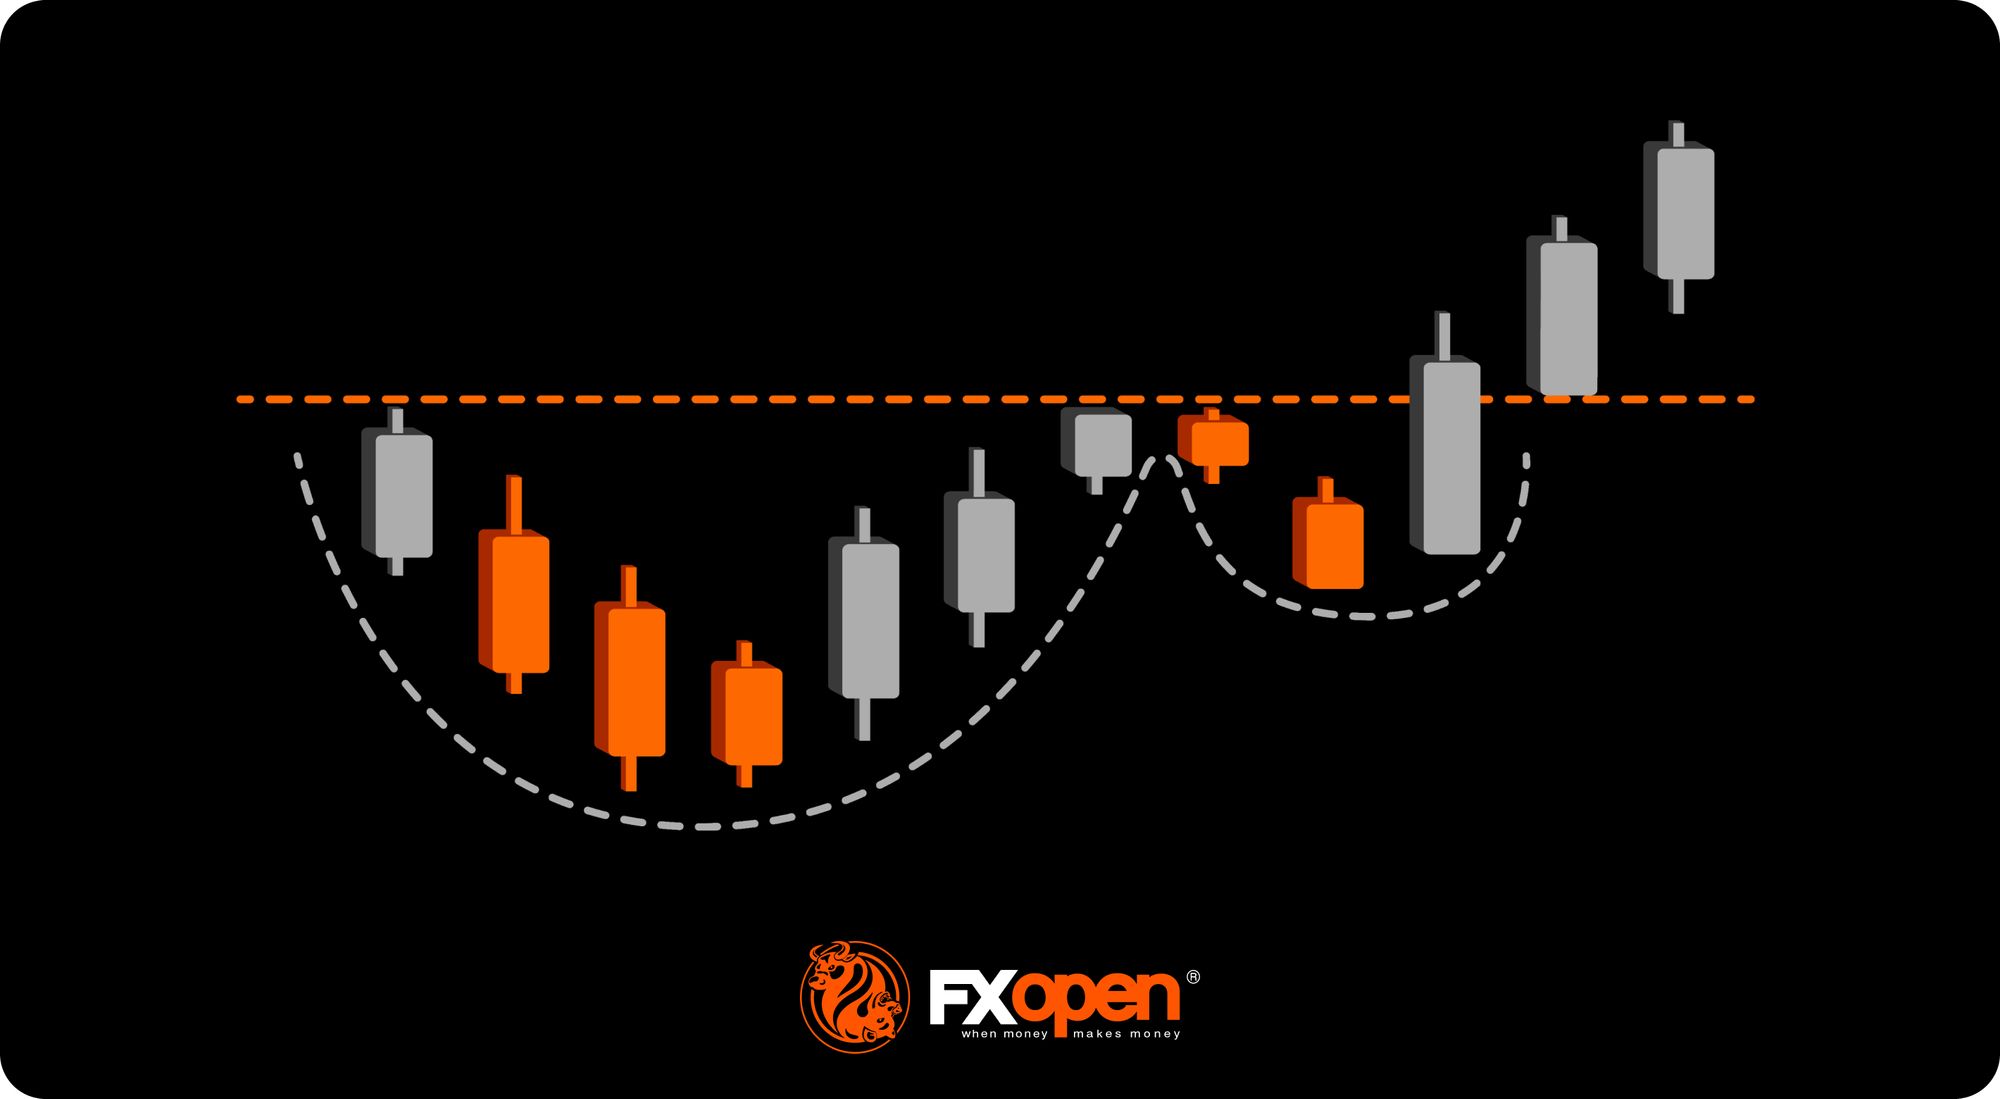
Its name comes from the shape it creates on the chart: a rounded bottom (cup) followed by a smaller pullback (handle). The cup shows a period of selling that transitions into buying, forming a U-shape. The handle is a short-term consolidation or drop around the cup’s high. The handle remains relevant as long as the price tests the upper trendline before buyers enter the market more aggressively.
The setup typically appears during an uptrend, though it can also be seen in a downtrend. It acts as a pause before the market moves higher, with the high of the cup acting as a resistance level. When the price breaks above that level, ideally on strong volume, it can signal the start or continuation of a bullish trend.
While the cup and handle chart pattern is bullish, it does have a bearish counterpart known as the inverted cup and handle. The bearish cup and handle follows the same format, just upside down.
How the Cup and Handle Forms
A cup and handle has three clear parts: the cup, the handle, and the breakout. Each plays a specific role and gives clues about momentum and sentiment.
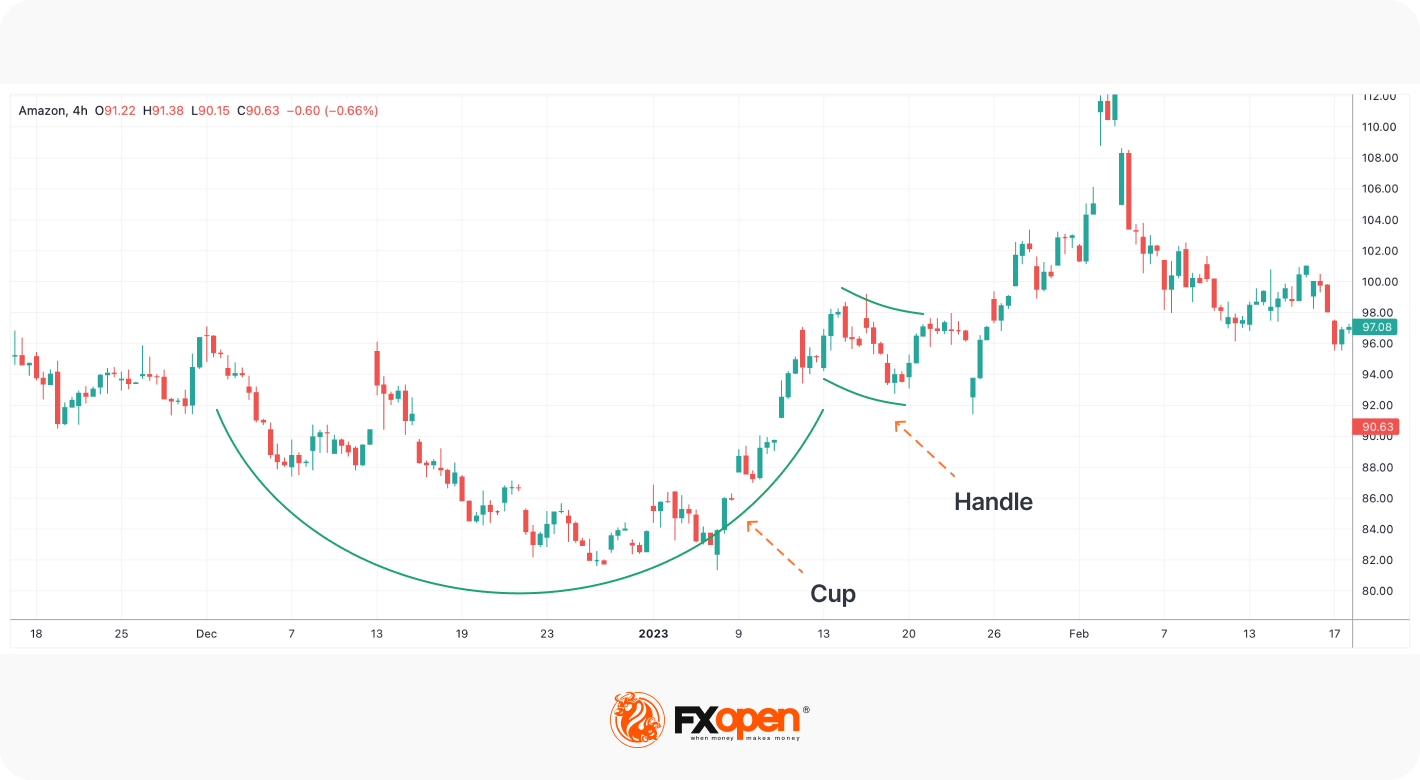
The Cup
The cup forms first. It usually starts after a rally, when the price pulls back and begins to base, though can build at the low of a downtrend. Instead of bouncing straight back, it curves gradually—dropping, bottoming out sideways, then rising again.
A well-formed cup has a rounded shape, not a sharp V. This slow curve suggests steady accumulation, rather than volatile buying. Ideally, the cup returns to the high of where the downward movement started, where it should find resistance. The resistance may be pierced slightly before a retracement occurs; some might consider this a stronger signal, given a previous high has been traded through.
The Handle
The handle comes next. It’s created after the price reaches the top of the cup and stalls. Traders anticipate this pause; short-term buyers close positions at the local resistance, while some sellers enter the market.
The handle usually drifts sideways or slightly lower and shouldn’t drop too far. Most traders look for a retracement of less than a third of the cup’s height. Anything deeper risks breaking the pattern.
The Breakout
The breakout finishes the setup. Price pushes above the high of the cup and the handle consolidation/retracement. A strong breakout shows buyers are in control and the trend is likely moving upward, especially if supported by high volume.
Try your skills at identifying the cup and handle pattern in stocks, forex, commodities, and indices with FXOpen’s free TickTrader platform.
Trading the Cup and Handle Pattern
As opposed to candlestick patterns, chart patterns like the cup and handle are slightly more dynamic. There are many variables that influence trading.
Identifying the Setup
Cup and handle setups that form in an uptrend tend to be considered more reliable since an established bullish trend is already present. According to theory, the setups tend to be a relatively deep retracement of the prior bullish leg, perhaps 30%-50%.
A stronger move lower encourages sellers to get involved, who then buy back their shorts as the price begins to rise again and fuel bullish momentum. However, shallower formations can still work, especially after a strong bullish leg.
When the cup and handle candlesticks appear in a downtrend, there is a risk that the formation is simply a short-term correction in a broader bearish trend. It may genuinely signal a new bullish trend if other factors line up, but it’s considered a riskier play.
The roundness of the cup matters too. An uneven cup with lots of back and forth can signal an uncertain market, in contrast to one that is resisting selling pressure and steadily rising again.
In terms of the handle, a clean handle that either represents a slight pullback or a tighter range is often more convincing. If the price breaks down too far, traders may start to question the structure.
As with any pattern, it helps to stack confluence factors. If the pattern:
- Forms at a support level or a previous resistance level turned into support
- Bounces off of a trendline, Fibonacci level or long-term moving average
- Coincides with a bullish signal from an indicator, such as a MACD crossover or RSI exiting oversold levels
- Aligns with fundamentals
Then a trader may be more confident.
Watching for the Breakout
The breakout level sits at the point where the price stalled before forming the handle. It can form above the high of the cup, or drop just below it. Generally speaking, the higher up the handle’s high reaches, the better; too low, and it may signal bearish momentum is slightly stronger than desirable. For instance, breaking through the high indicates that resistance was weak, which is good for the potential upward movement.
Some traders will just wait for a confirmed close through the handle’s high. Others might want to see the price hold above it for a few more candles or watch for strong bullish candlesticks.
Timeframes
The cup and handle trading pattern appears on all timeframes, from the 1-minute to monthly charts. However, the timeframe affects how much attention a trader gives to it.
A pattern on the daily or weekly chart can have more significance. For one, it tells a story about the sentiment and positioning of buyers and sellers over many sessions, rather than just one or two. It also allows a trader to anticipate intraday price movements and establish a higher timeframe bias.
That’s not to say intraday cup and handle patterns don’t work, just that they’re likely to hold less meaning and be shorter-lived.
Volume
Volume isn’t always required for the pattern to work, but it often helps confirm what the price is doing. Low volume during the handle shows hesitation or lack of interest from sellers—a desirable feature. Meanwhile, a sharp rise in volume during the breakout often reflects real buying pressure.
Entries and Exits
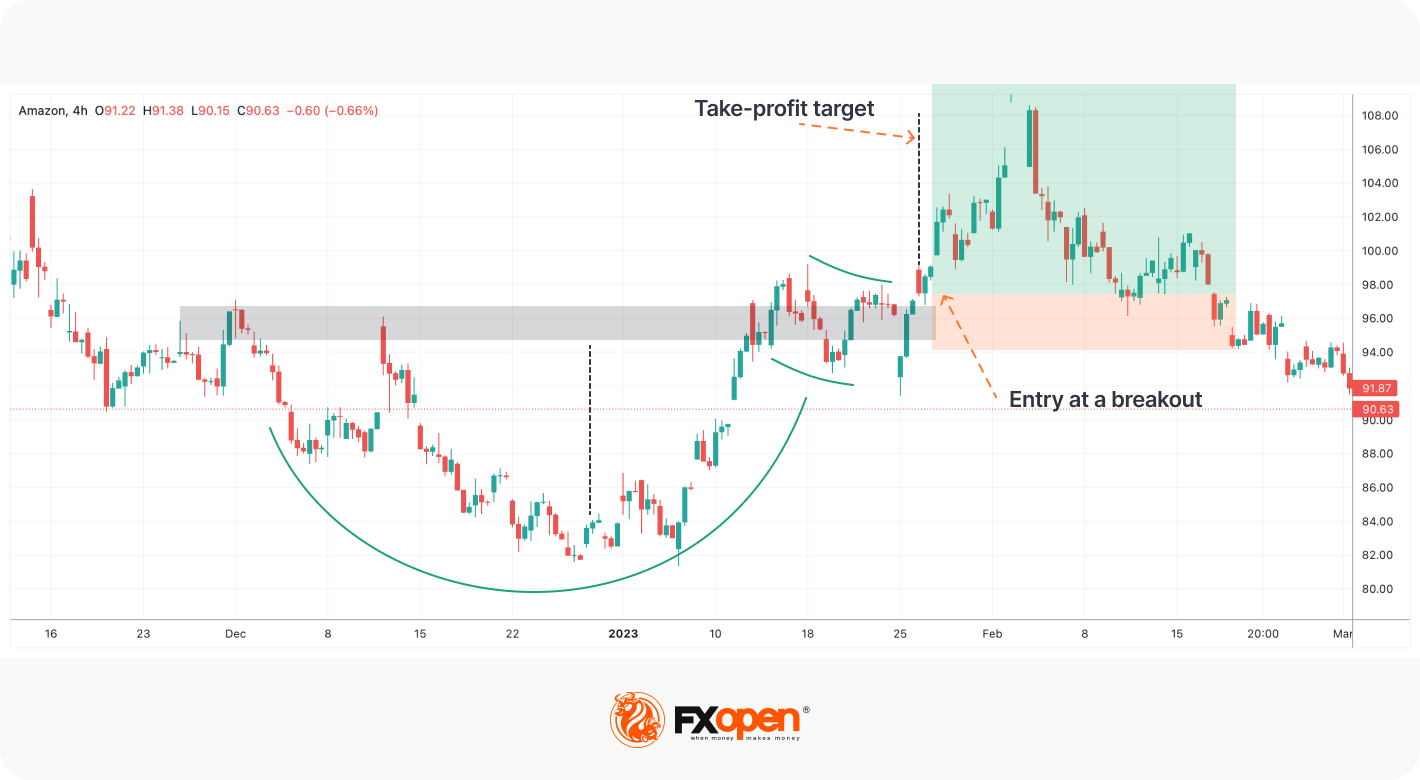
Once the breakout is confirmed, traders will look for an entry. Some traders place a market order once they have conviction the breakout is genuine. An alternative approach is when traders consider a buy stop order at the resistance level (either the cup or handle high).
Stop losses might be placed below the low of the handle since a break below can invalidate the setup. Take-profit targets are context-dependent. Some might project the height of the cup and add it to the entry point. Others might evaluate trend strength and hold for longer, closing the trade at the next resistance level or when a technical indicator/pattern determines a bearish reversal.
Limitations and Common Mistakes
The cup and handle isn’t foolproof. Traders who rely on the shape alone, without considering context or structure, can get caught out.
Not All Patterns Play Out
Sometimes, the pattern appears but the price doesn’t break out as expected, instead moving lower. This is a feature of all patterns; no formation is 100% guaranteed.
False Breakouts
Tied to the previous point, some breakouts may simply be a false breakout or bull trap. Confirmation from subsequent candles can help prevent jumping into a false breakout.
Misreading Uneven Structures
Not every rounded dip with a pullback is a cup and handle, meaning that choppy, inconsistent moves may be ignored. This might often reflect indecision rather than accumulation. Forcing a pattern where it doesn’t exist can lead to a poor trade.
Entering Too Early
Some traders jump in as soon as they spot the handle and expect an immediate breakout. But until the price breaks through resistance, there’s no confirmation the setup is valid.
Overlooking Trend Context
A cup and handle that forms against the broader trend, or in the middle of a messy range, is less convincing. Structure matters. Without clean context, the pattern may lose reliability.
Placing Stops Too Tight
Tight stops right at the breakout level or within the handle can get taken out by normal volatility. The low of the handle typically gives a more logical invalidation point.
The Bottom Line
The cup and handle is a clear, structured way to analyse and trade potential breakouts. Context matters, but it can offer a straightforward trading approach. However, as with any trading tool, it is usually combined with strong risk management and broader analysis.
If you’re ready to implement this pattern into your trading strategy, consider opening an FXOpen account to start exploring the cup and handle formation’s signals across over 700 live markets with tight spreads and low commissions.
FAQ
What Are the Rules for the Cup and Handle Pattern?
In terms of the cup and handle pattern rules, traders typically look for a rounded cup followed by a handle that retraces less than a third of the cup’s depth. The handle should start forming near or above the cup’s high, and the breakout of the pattern should happen above the resistance level, ideally with increased volume. A clean structure, a gradual cup, and a shallow handle are considered stronger signs.
What Are the Different Types of the Cup and Handle?
There are two main types: the standard cup and handle, which provides a bullish signal and usually appears in an uptrend, and the inverted version, which signals a downward price movement and typically forms in a downtrend. Some traders may also distinguish between deep and shallow cups based on the retracement depth.
What Is the Cup and Handle’s Success Rate?
Trading efficiency depends on many factors, like timeframe, market conditions, structure, and trader’s skills. According to theory, well-formed cup and handle patterns on higher timeframes, like the daily or weekly charts, tend to provide more reliable signals, but no pattern works every time.
Is There the Opposite Pattern of the Cup and Handle?
The opposite of the bullish cup and handle is the inverted cup and handle, a bearish reversal setup that mirrors the standard pattern upside down.
This article represents the opinion of the Companies operating under the FXOpen brand only. It is not to be construed as an offer, solicitation, or recommendation with respect to products and services provided by the Companies operating under the FXOpen brand, nor is it to be considered financial advice.
Stay ahead of the market!
Subscribe now to our mailing list and receive the latest market news and insights delivered directly to your inbox.


Latest articles

GBP/CHF: Trendline or RSI — Which One Is Lying?
Sterling enters this week on firmer footing, with political uncertainty fading fast after Andy Burnham's confirmation as Labour leader eased investor concerns over the succession to Keir Starmer. Markets reacted further to reports pointing to Shabana Mahmood as the frontrunner

Silver Attempts to Break Out of Its Range
Silver continues to balance between its dual role as an industrial metal and so-called refuge asset, and this combination largely explains the lack of a clear trend in recent weeks. Shifting expectations for central bank interest rates can influence the

Nasdaq 100: Is This the Correction Traders Have Been Waiting For?
The Nasdaq 100 (US Tech 100 Mini on FXOpen) remains caught between two opposing forces: cooling inflation on one side, and persistent geopolitical instability on the other. On 14 July, June's CPI print came in softer than expected, easing near-term