


Mastering Trading with Continuation Candlestick Patterns
FXOpen
Continuation candlestick patterns are a common tool traders use in technical analysis to identify when a prevailing trend is likely to continue after a pause. In this FXOpen article, we explain how continuation candlestick patterns work, and how you can use them to identify market trends and make informed trading decisions.
What Is a Continuation Candlestick Pattern?
Candlesticks are a popular tool in technical analysis used by traders to visualise price movements in financial markets, including forex, stocks, and commodities. They show the opening, closing, high, and low prices of an asset within a specific timeframe (such as 1 minute, 1 hour, 1 day, etc.). Continuation candlestick patterns are chart formations that indicate the current price trend (whether bullish or bearish) is likely to continue, rather than reverse.
Bullish continuation candlestick patterns form when rising prices pause, consolidate and then continue moving higher. Bearish continuation candlestick patterns form when falling prices pause, consolidate and then continue moving lower. They often occur when buyers and sellers pause to reassess their trading positions, allowing the market to gather momentum for the next move in the direction of the trend.
Continuation candles are typically characterised by the price stabilising after a sharp move in either direction, although some, such as gaps, indicate that the move is accelerating.
How Traders Use Continuation Patterns
Trend continuation candlestick patterns are relatively straightforward to interpret, making them easy to use for traders with any level of experience. They form across 1-5 candles, unlike chart patterns that form across 10-50 candlesticks. Continuous candlestick patterns help traders filter out noise on charts so they can focus on the prevailing market direction to improve their trading strategy.
You can analyse them to:
- confirm the market’s direction and momentum;
- choose an entry or exit point for a trade;
- manage risk based on market sentiment.
Rules Traders Follow When Using Candlestick Formations
There are some basic rules traders follow to make informed trading decisions when using trend continuation patterns:
- Analyse the trend. Traders identify a trend before looking for a continuation pattern, as they only make sense in the context of a strong trend.
- Wait for confirmation. The theory suggests traders wait for at least two or three consecutive candles to take shape after the pattern to make a trade. This may help them avoid false signals.
- Use support and resistance levels. Traders check how a pattern relates to significant support and resistance levels, as the signals are typically more reliable when they coincide.
- Combine with other technical indicators. Traders use candlestick patterns in conjunction with other technical indicators, such as moving averages and oscillators, to confirm a trend continuation.
A List of the Most Popular Continuation Patterns
You can identify patterns from the shape and structure of the candlesticks. Here are commonly used formations to look for.
Gaps
Gaps occur when there is a significant difference between the closing price of one candlestick and the opening price of the next. Gaps tend to occur at the opening of a trading session, reflecting a change in sentiment overnight.
Bullish and Bearish Tasuki Gap
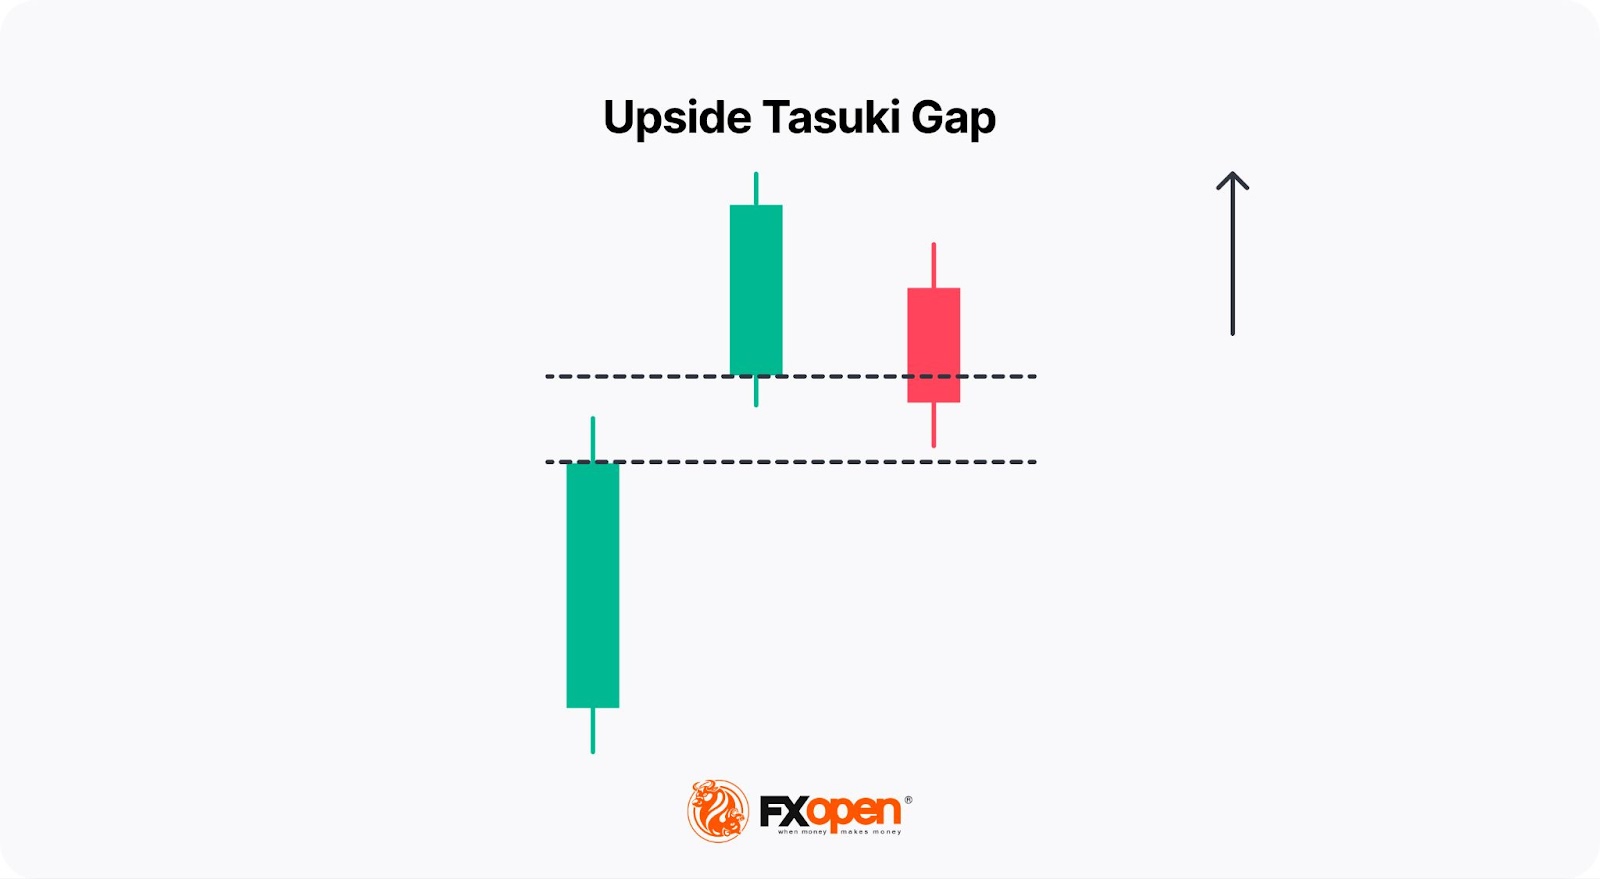
A tasuki gap is a three-candle pattern. In a bullish or upside tasuki gap, the first candle is large and bullish, the second candle moves upward with an opening price gapping up from the previous close, and the third is a red that partially closes the gap.
The gap and the second bullish candle indicate the strength of buyers. The third denotes a pause in the trend as sellers attempt to move the price lower but fail to close the gap, which suggests that the rally is likely to continue.
Traders use a rising tasuki gap to enter a position on the close of the third candle and place a stop-loss order below the bottom of the first candlestick, expecting the trend to resume upward. Another option they use is to place a buy order slightly above the second candle’s high and set a stop under the low of the third candle.
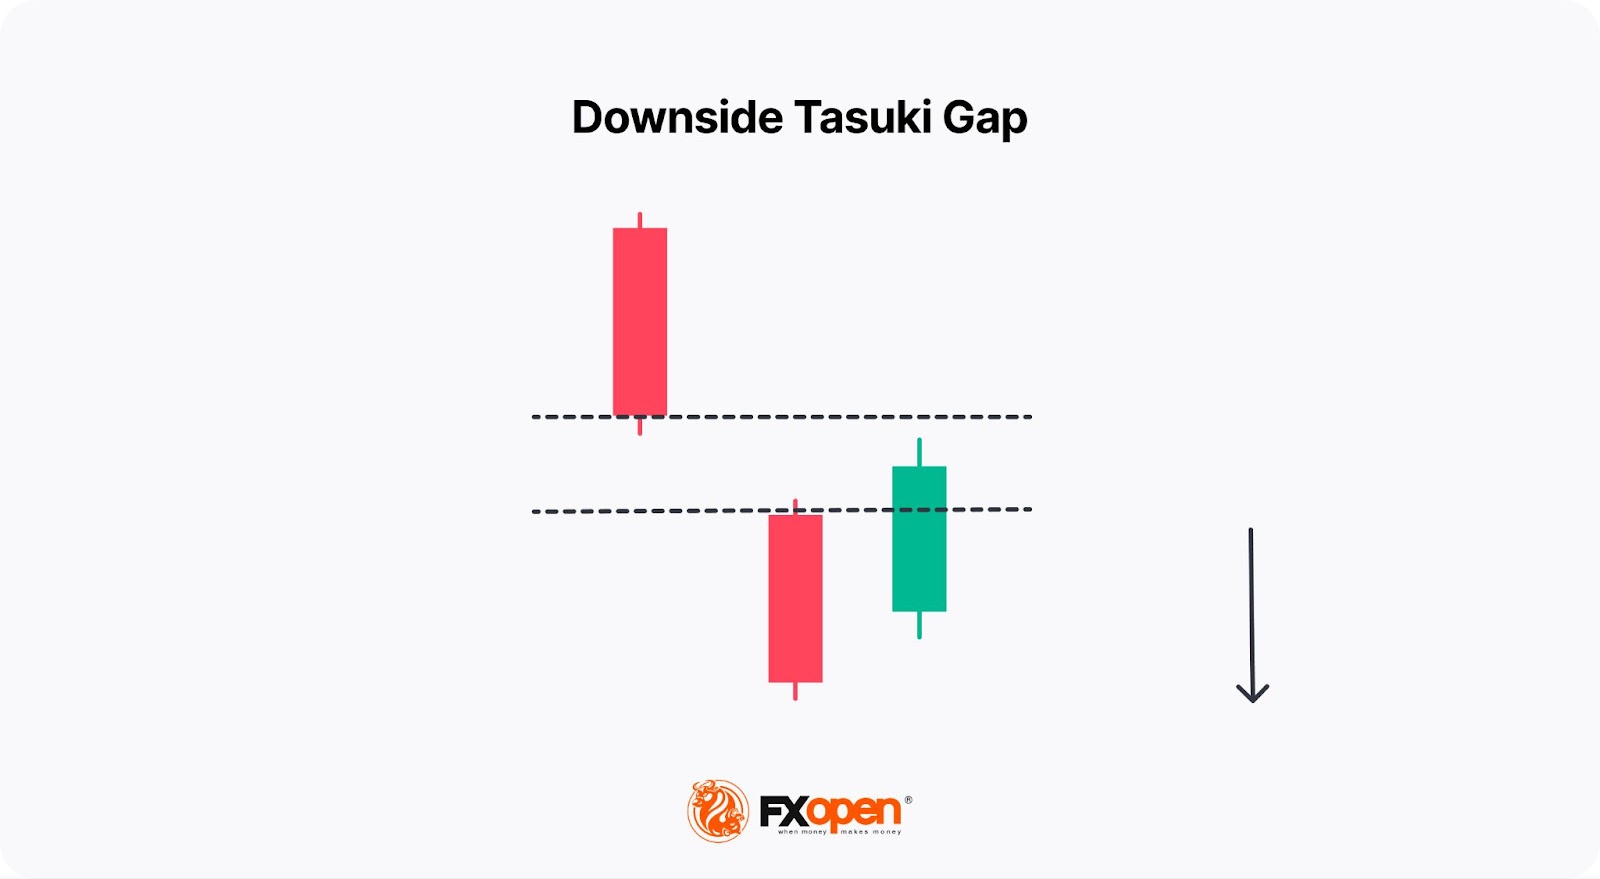
In a bearish or downside tasuki gap, the first candle is large and bearish and the second gaps down from the close of the first. The third candlestick closes above the opening price of the second but does not cover the gap.
The downside tasuki gap reflects the momentum behind a downward trend. The strength of the trend is indicated by the price gapping lower and a new red candle forming. This move is followed by a pause as buyers attempt to push the price higher. However, the price does not fill the gap, and the downtrend is resumed.
Traders open a short position near the close of the third candle, expecting the downtrend to continue. Alternatively, they wait for the price to drop below the low of the second candle to confirm the downtrend is resuming.
Bullish and Bearish Gapping Play
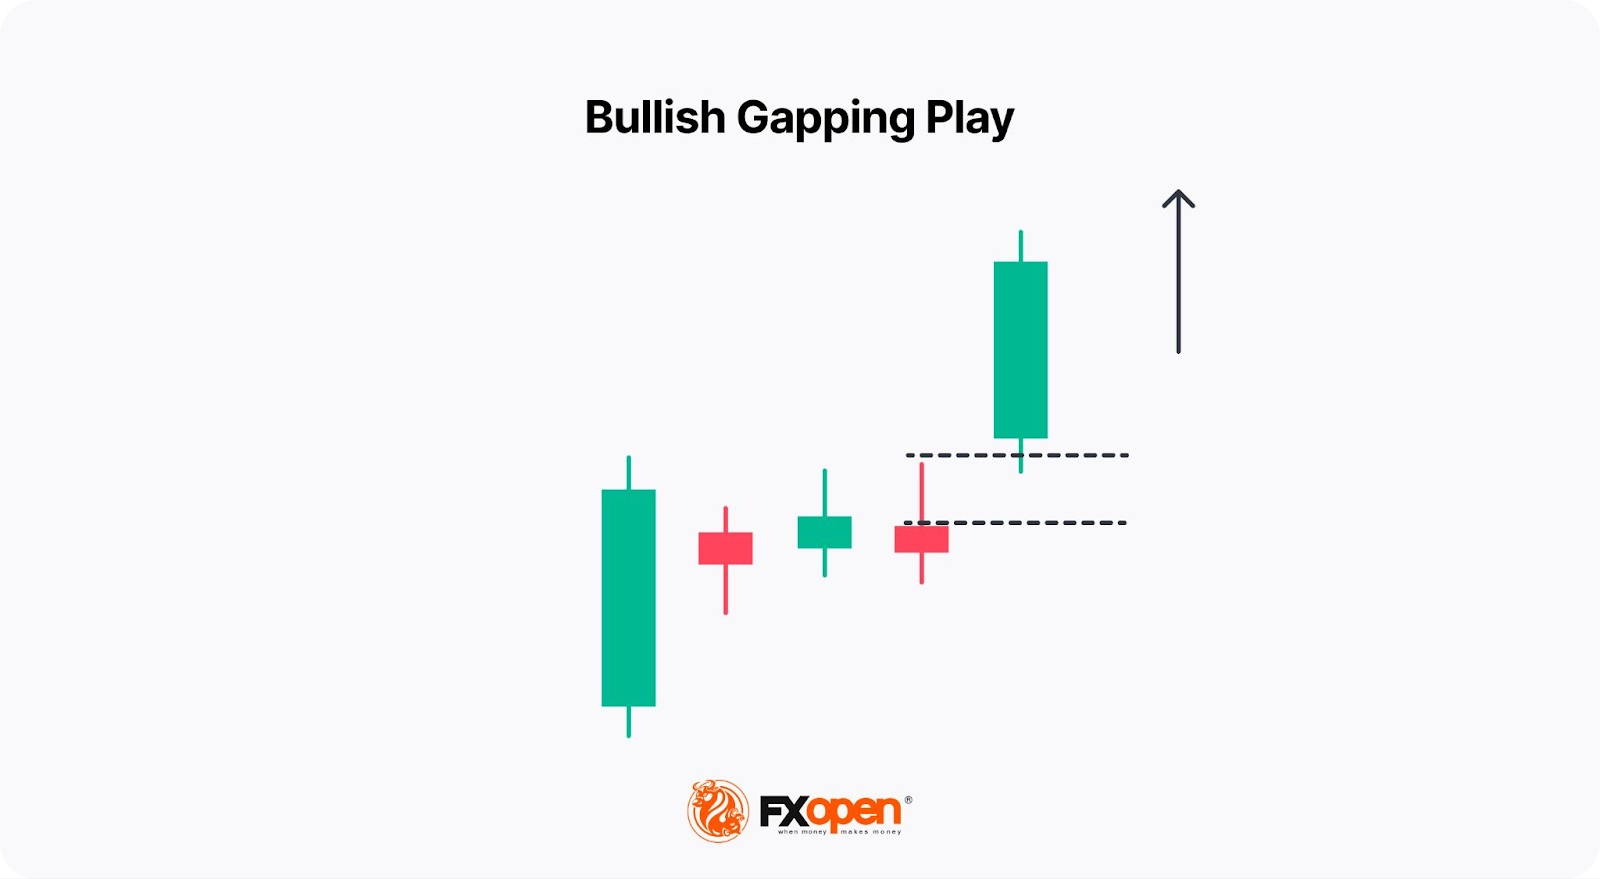
A bullish gapping play structure occurs when there is a large upward candle, followed by several small candles forming at almost the same level and a large bullish candle with an upward gap. Small candles in this bullish continuation pattern reflect a period of hesitation and must be in the upper area of the previous candle.
The bullish gapping play provides traders with a strong signal that the bullish momentum is expected to continue. Therefore, the theory suggests that a trader opens a buy trade after the last candle of the pattern (large bullish candle with a gap up) is formed. A stop-loss order is placed below it.
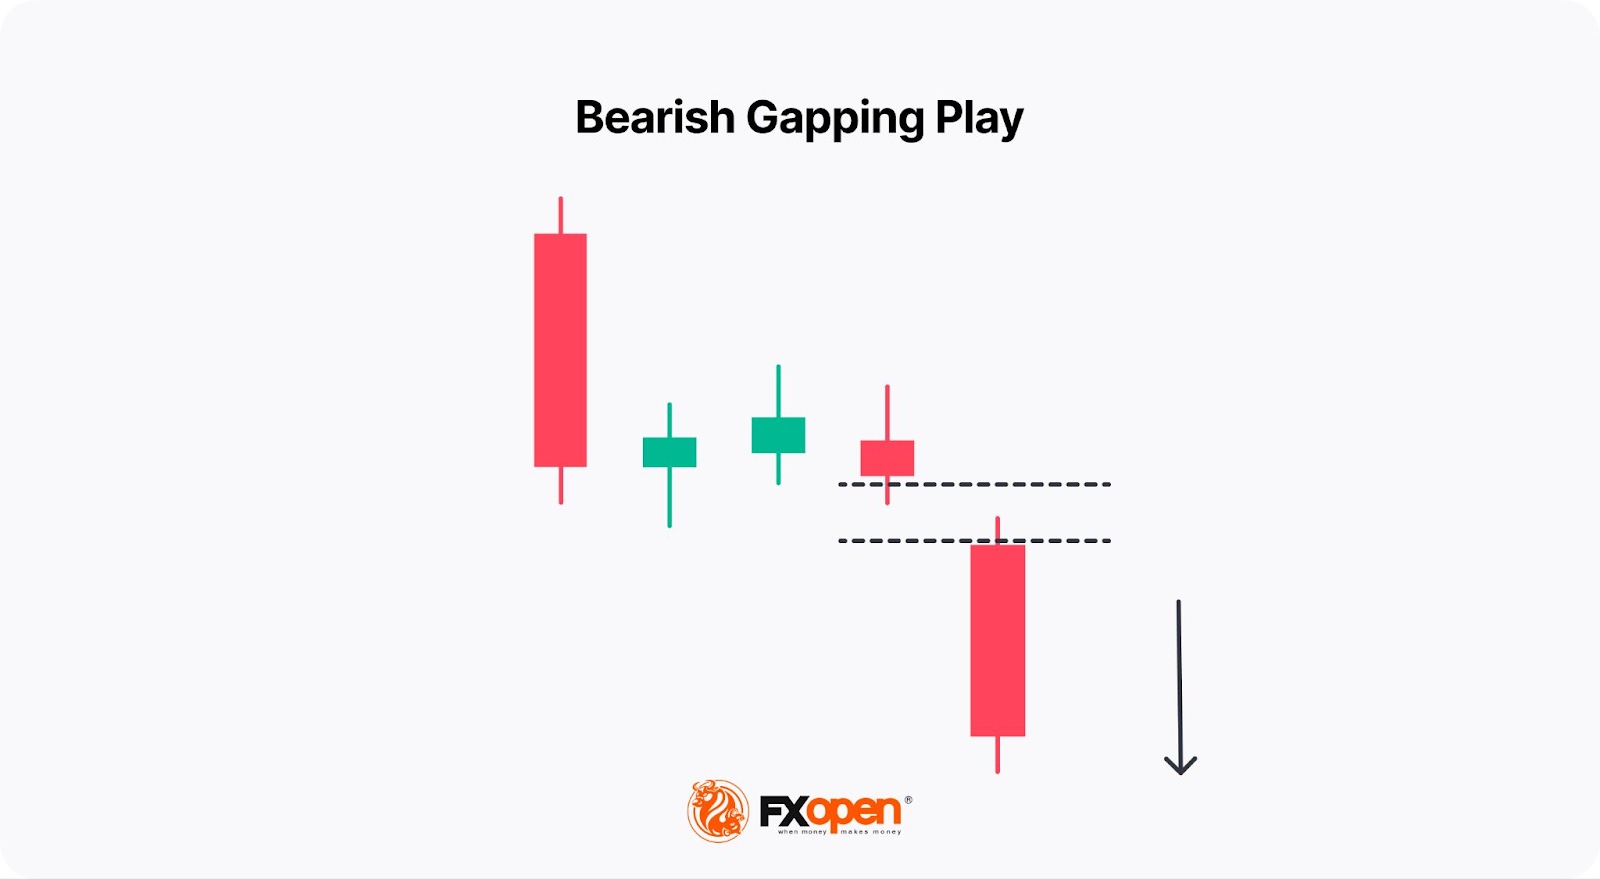
A bearish gapping play has one long bearish candle, several small candles, and a large downward candlestick opening with a gap down. The structure follows a pause in the trend indicated by the small candles occurring after a series of large downward candles. The small bars before the gap must be in the lower area of the previous large falling candle.
The bearish gapping play offers a strong signal that the bearish momentum will continue. Traders usually open a sell position after the last candle of the pattern (large bearish candle with a gap down) is formed. A stop-loss level is placed above it.
Rising and Falling Three Method
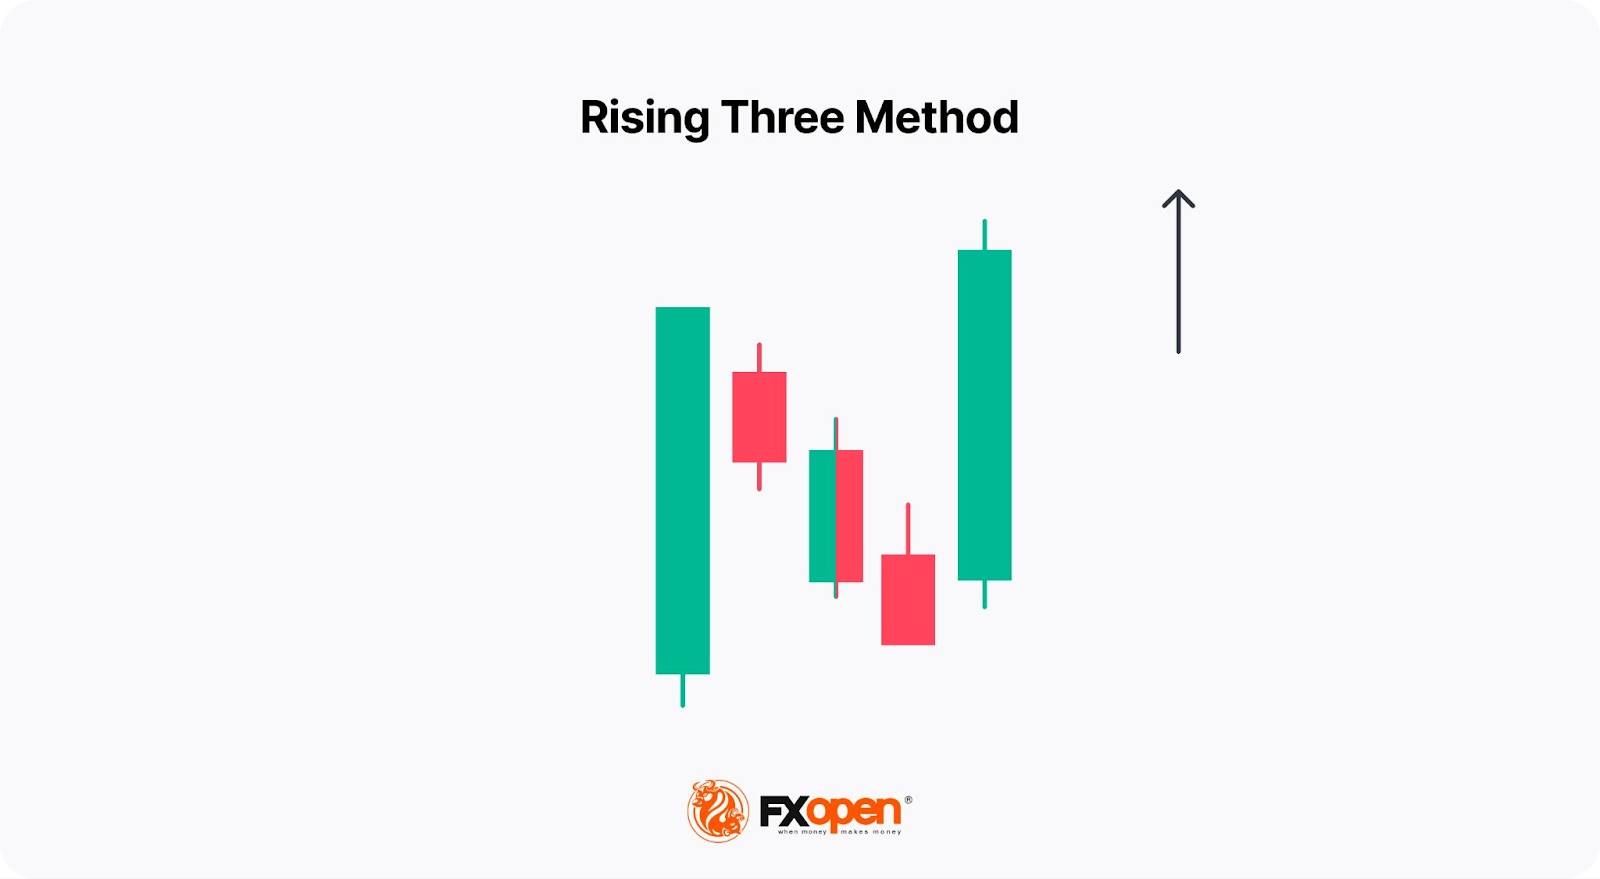
A rising three method forms when a market is consolidating, but the momentum remains intact, and the upward trend may continue after the pause. The structure is formed from five candles, with a long upward bar followed by three shorter downward bars that remain within the range of the first. The next bar is long and bullish. It closes above the high of all previous candles.
In a conservative approach, traders enter the market after several candles after the pattern forms. In an aggressive approach, traders enter the market after the fifth candle is formed. A stop-loss level is usually below the fifth candlestick or is based on the risk/reward ratio of 1:2 or 1:3.
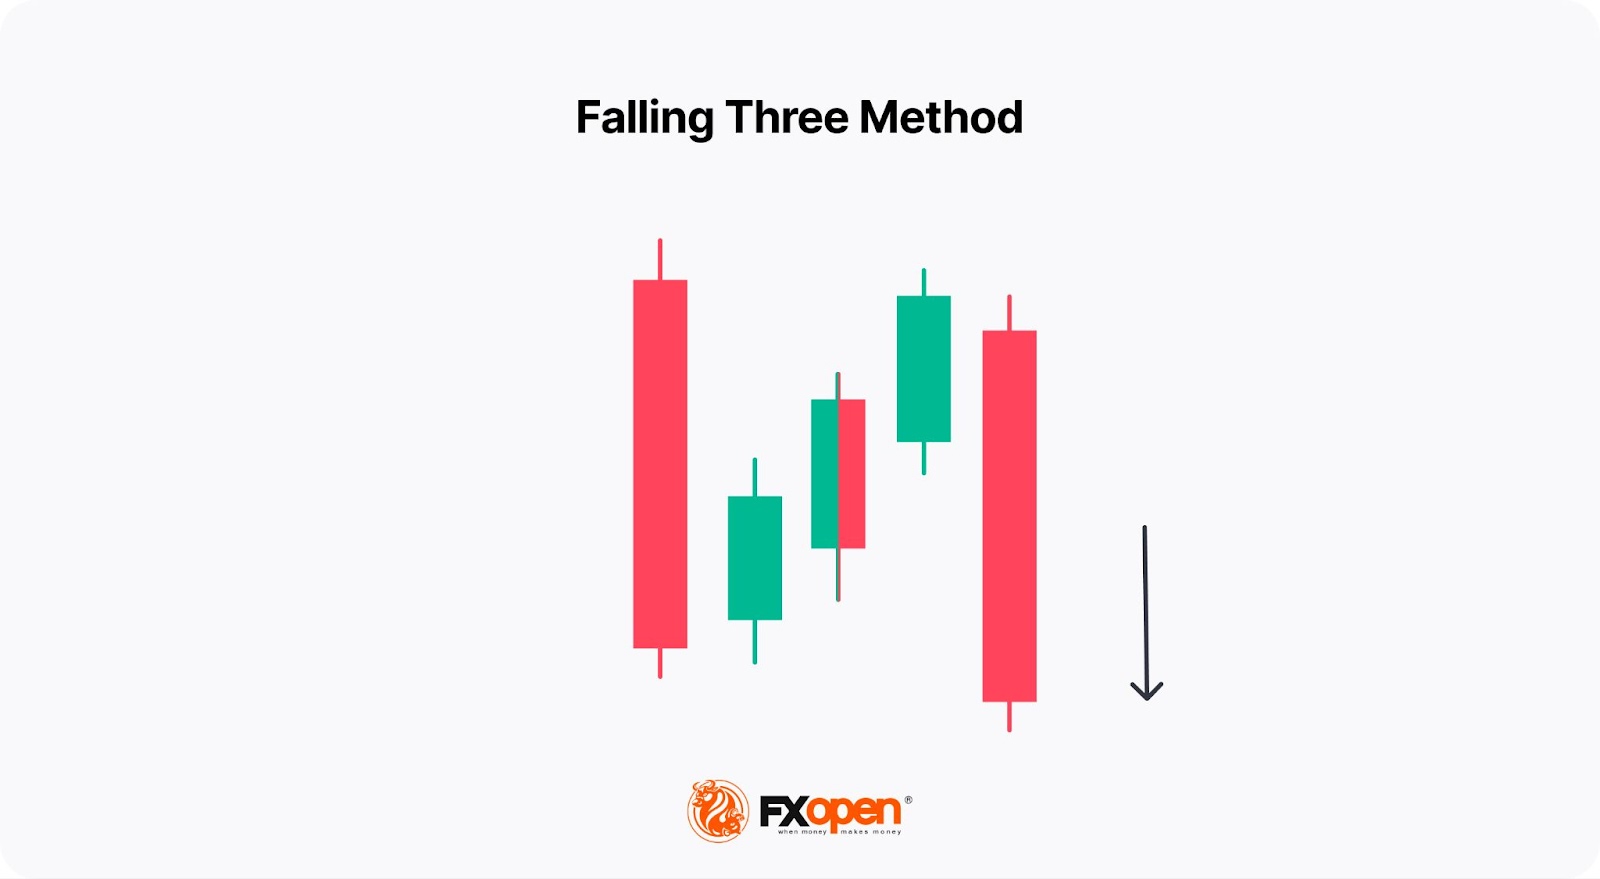
A falling three method forms when bearish momentum remains intact, and the downward trend may continue after a period of consolidation. The first long downward candle is followed by three shorter rising bars that remain within the range of the first. The fifth bar is long and bearish. It closes below the low of all previous candles. The pattern is established when the bulls begin to take control but are unable to complete the turnaround and are overwhelmed by the bears.
Conservative traders wait for several candles after the pattern to form. In an aggressive approach, traders open sell positions when the fifth candlestick is formed. A stop-loss level is placed above the fifth candlestick or based on the risk/reward ratio of 1:2 or 1:3.
Mat Hold
A mat hold is a variation of the rising or falling three methods.
In a bullish mat hold structure, the initial candlestick has a large upward body. It is followed by a gap up (which is not seen in a rising three method) and then three smaller bars that move downward but above the low of the first bar. The fifth bar has a large body and moves higher.
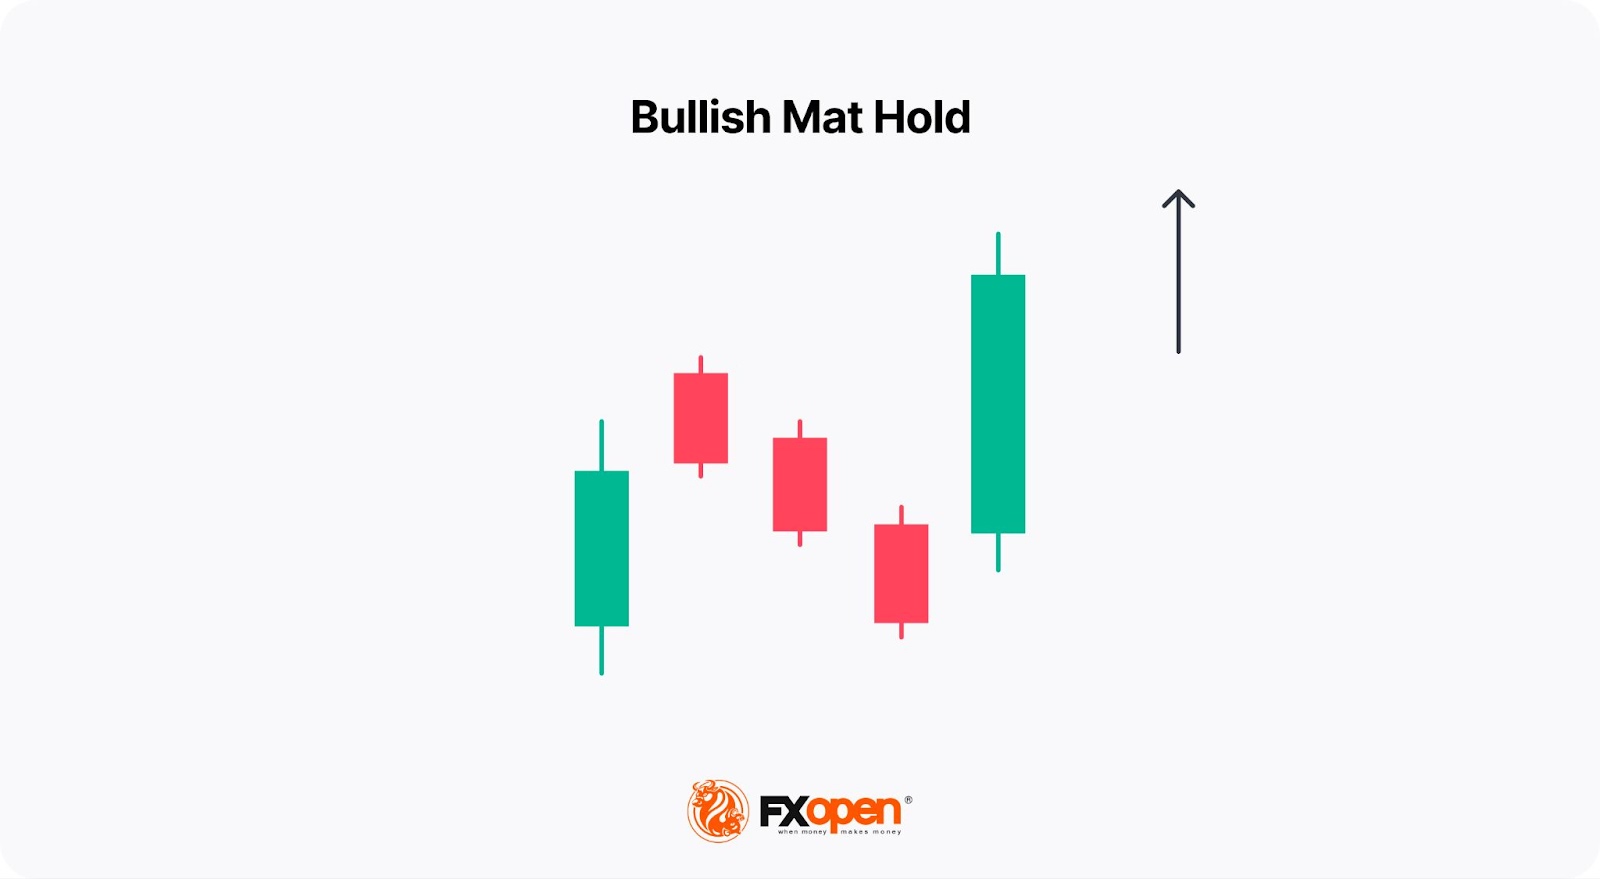
The shape suggests a pause in the upward trend, but as the fifth candle closes higher than the first, it indicates the momentum remains strong and the market could continue in the same direction. Traders use the pattern to buy near the close of the fifth bar or on the next candle, with a stop loss being placed below the fifth candle’s low.
In a bearish mat hold formation, the first downward candle is followed by a gap down and three small candles that move higher but below the high of the first. The fifth bar has a large body and closes lower than the first.
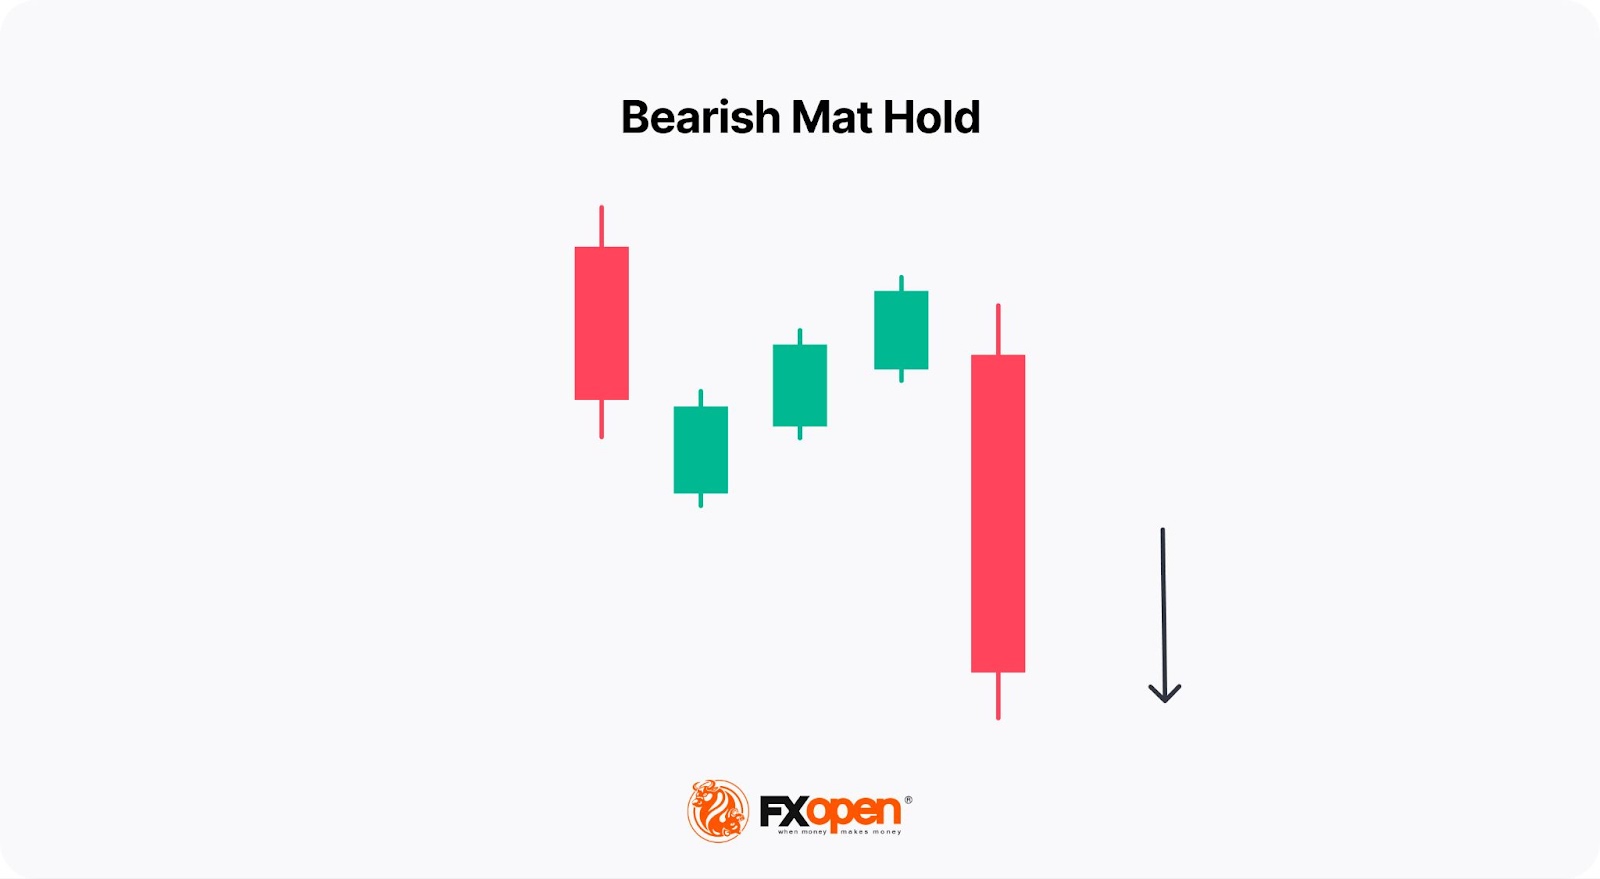
Traders can use a bearish mat hold to sell near the close of the fifth candle or on the next one and place a stop loss above the high of the fifth candle.
Separating Lines
Separating lines are a dual candlestick pattern formed by two opposite candlesticks.
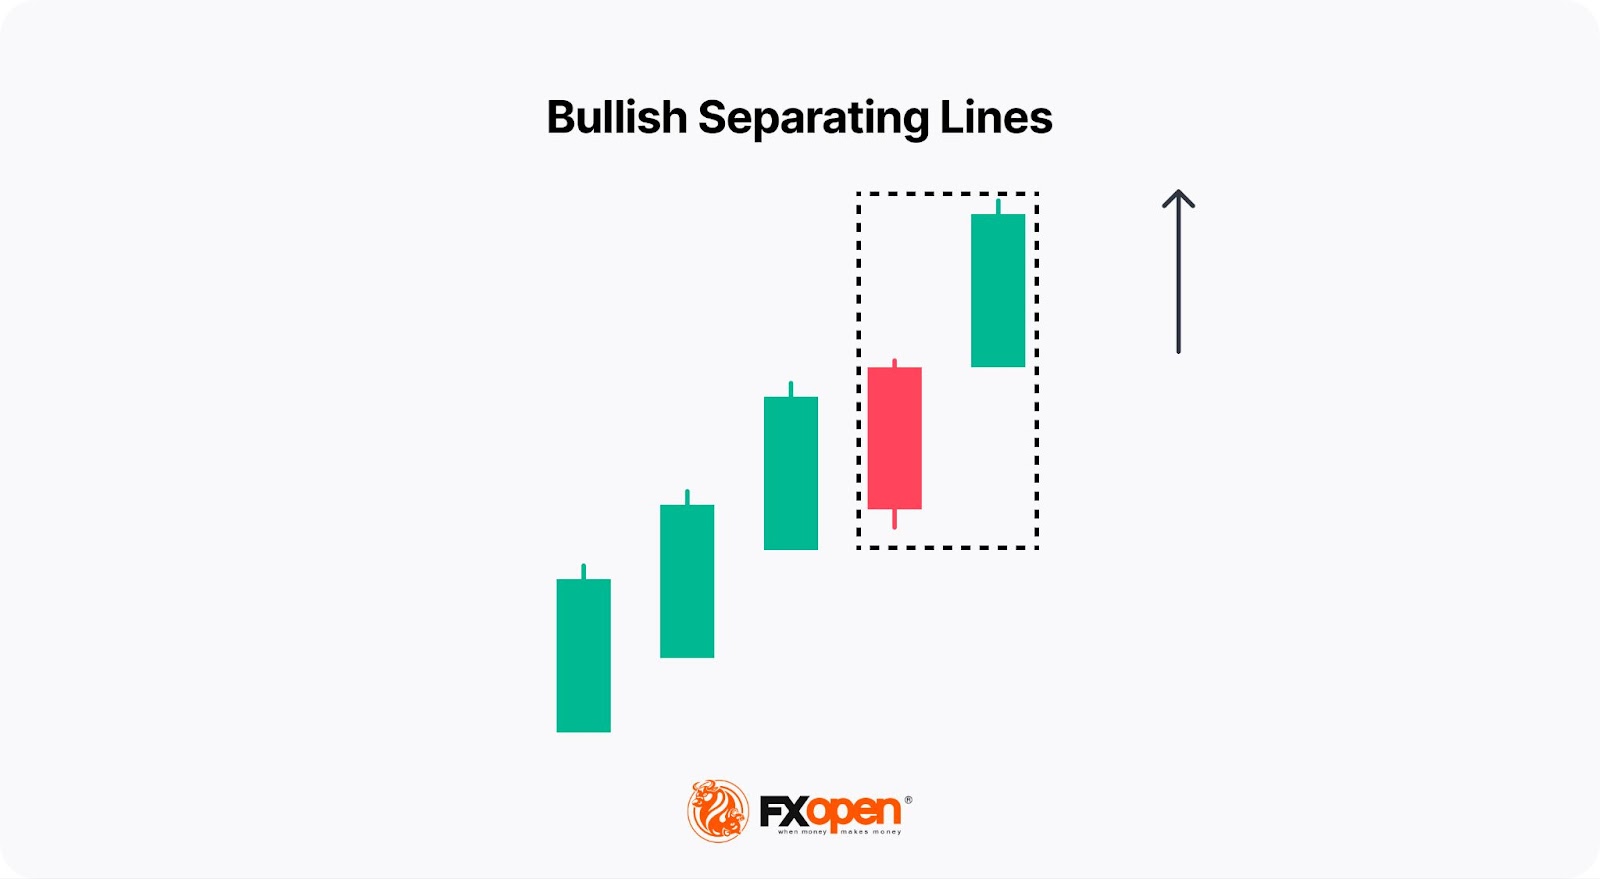
A bullish separating lines formation occurs in an upward trend. The first candlestick is a long downward candlestick counter to the prevailing trend, and the second one is upward. Both candles open at the same level. This suggests that the rally’s momentum may be slowing, but it is still likely to continue.
Traders use the pattern as a signal to buy above the bullish second candle. They usually place a stop loss beneath the first bearish candle to protect the long position from retracement.
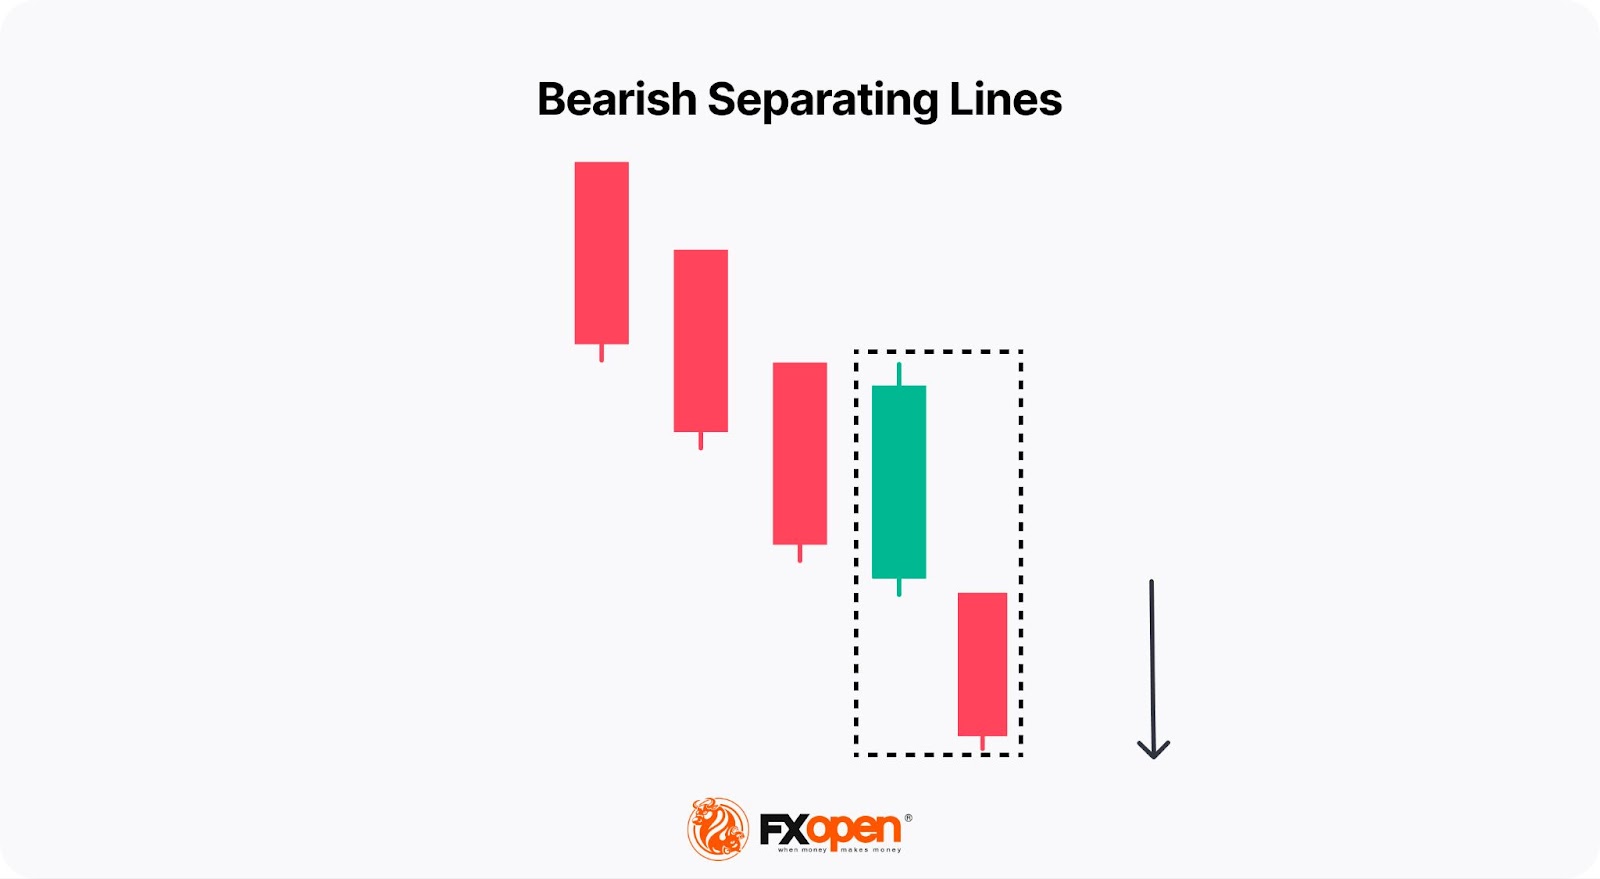
A bearish separating lines pattern forms during a price decline. The first candle is long and upward, countering the prevailing trend, and the second one is bearish. Both candles should open at the same level.
Traders use the formation of separating lines as a signal to sell below the bearish second candle, with a stop loss above the first pattern’s candle.
Three Line Strike
A three line strike consists of four candlesticks.
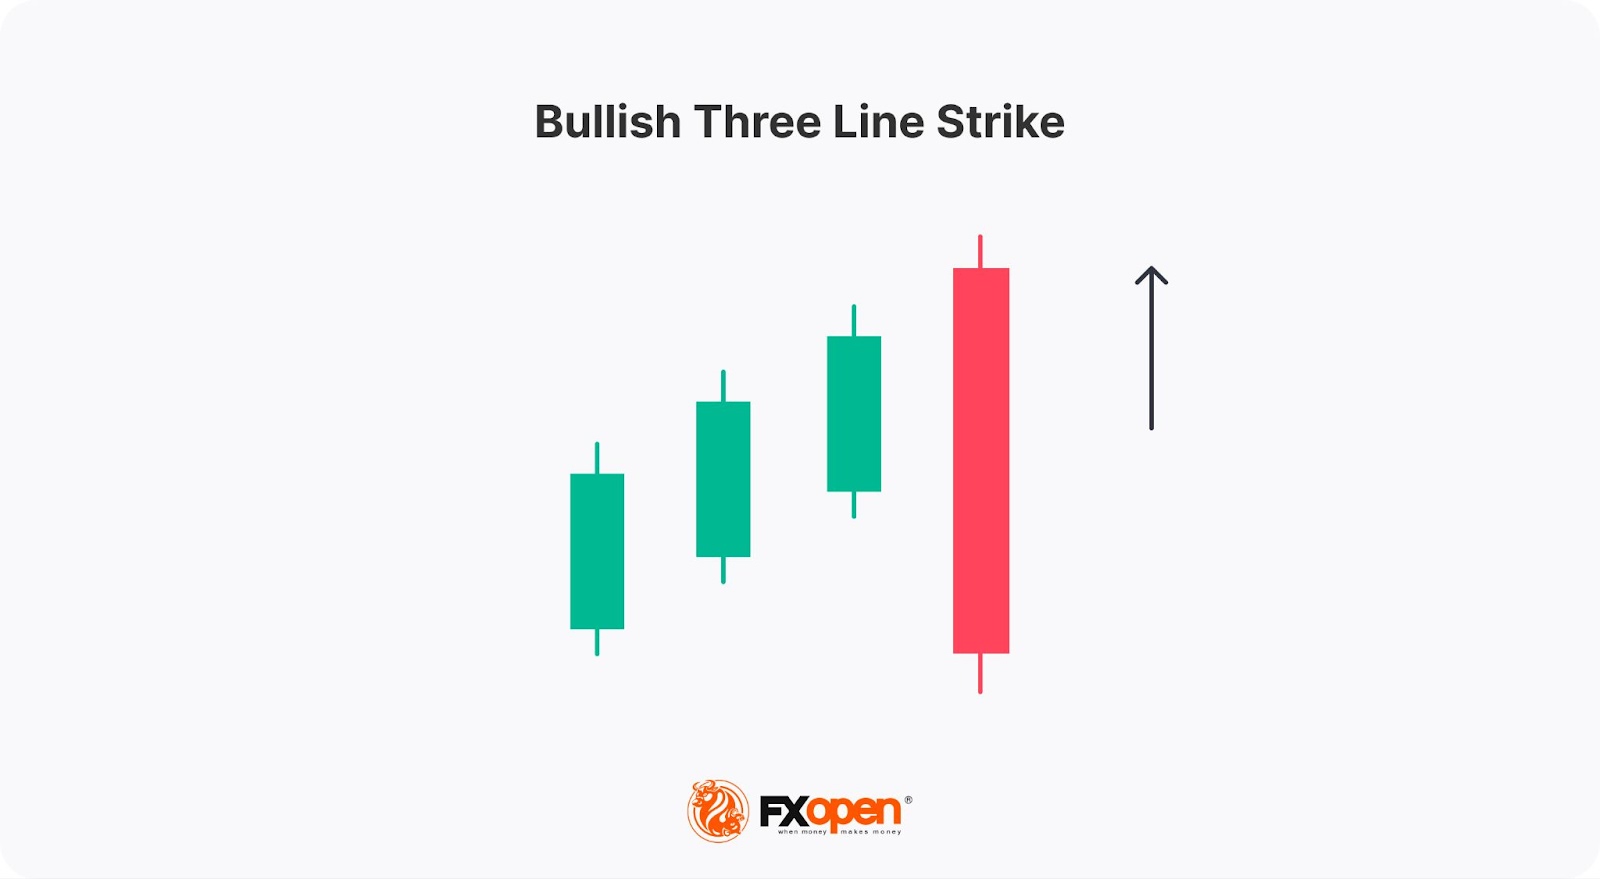
In a bullish market, the first three candles are long and continue upward with higher closing prices, the second and third open within the previous candle’s body, and the fourth opens at a higher price but closes lower than the first candle’s open.
Traders use the fourth candle as an entry point to take advantage of the subsequent continuation of the rally. They place a stop loss below the fourth candle and adjust it higher as the price rises.
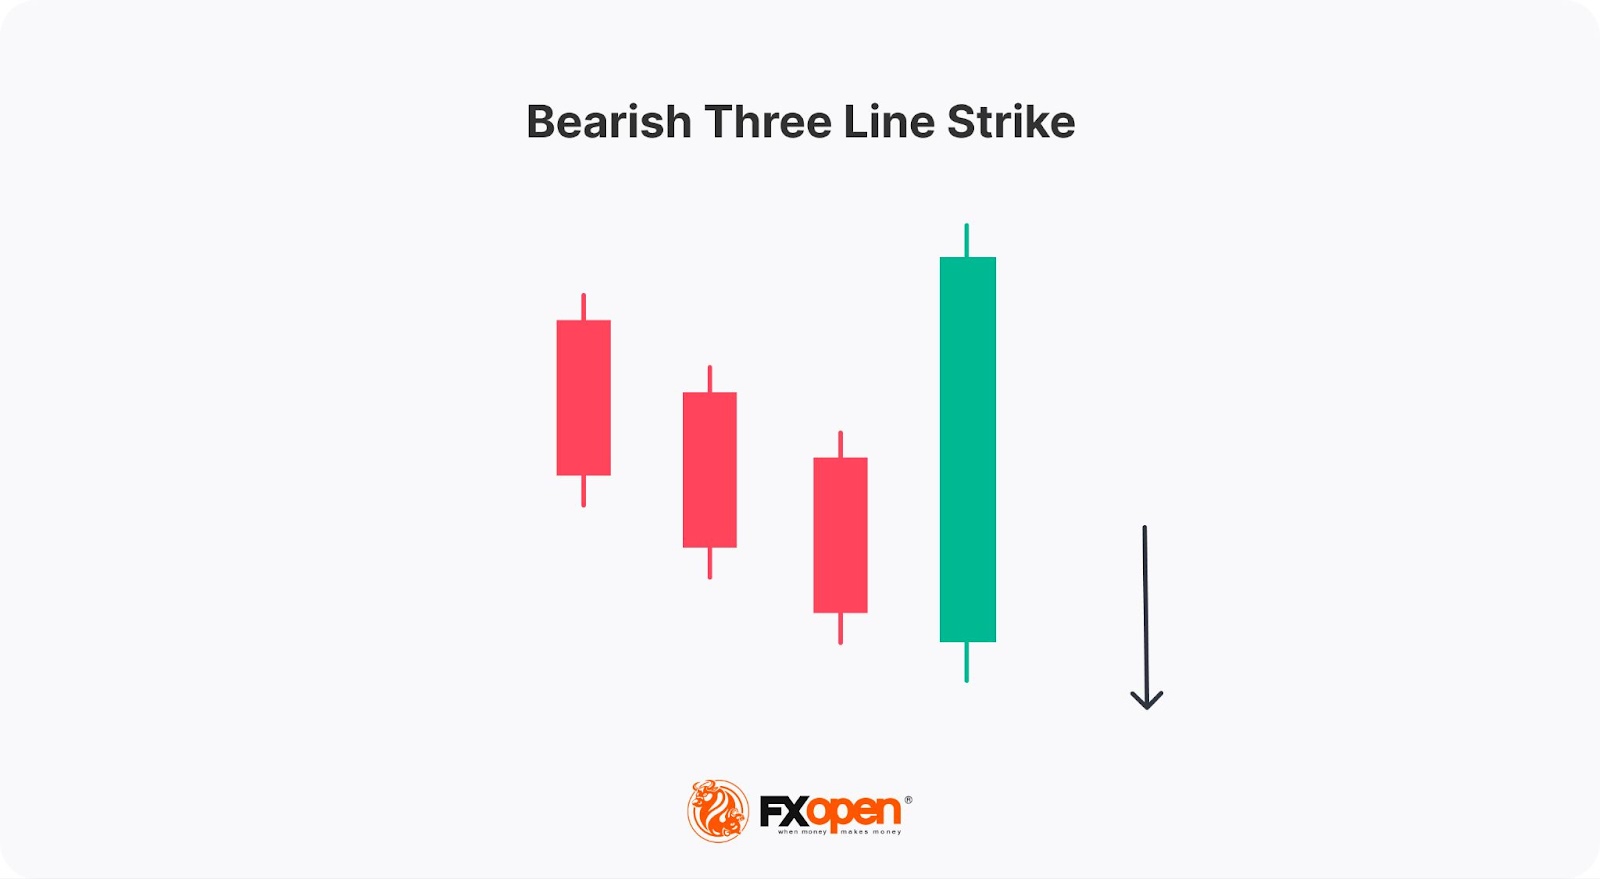
In a bearish market, the first three candles continue downward with lower closing prices, the second and third open within the previous candle’s body, and the fourth opens at a lower level but closes at a higher level than the first candle’s open.
Traders take the fourth candle as a signal to sell, with an entry point at the bottom and a stop loss above the high of the fourth candle to protect the position in the case of a reversal.
Common Mistakes
When trading with continuation candlestick patterns, traders often make several common mistakes that can lead to losses or missed opportunities. Here are some of the most frequent pitfalls:
- Ignoring the overall trend: Continuation patterns only work when there is a clear prevailing trend. Attempting to apply them in choppy or sideways markets can produce unreliable signals.
- Failing to wait for confirmation: Many traders jump into a trade after spotting a pattern without waiting for confirming signals, such as the next few candles or technical indicators. This can result in entering trades based on false signals.
- Neglecting support and resistance levels: Overlooking important support and resistance levels can lead to poor entry or exit points. Patterns near these levels are potentially more reliable.
- Overtrading: Some traders try to find continuation patterns too frequently, leading to forced trades. Not every market condition will present clear or reliable continuation patterns.
- Ignoring risk management: Failing to set appropriate stop-loss levels or neglecting position sizing can result in significant losses, even when the pattern appears strong.
Confirmation Tools
Confirmation tools help traders verify whether a continuation candlestick pattern is likely to play out as expected. These tools are used to confirm trends and ensure traders aren't acting on false signals. Some of the most commonly used confirmation tools include:
- Moving Averages: Traders often use moving averages (MA) to confirm the trend direction. A continuation pattern in a bullish trend can be validated if the price stays above the moving average. Similarly, a bearish trend can be confirmed if the price remains below the moving average.
- Volume Analysis: Volume spikes can confirm the strength of a pattern. If a continuation pattern forms with increased volume, it suggests more market participants are involved, making the trend more likely to continue. Low volume, however, could signal a lack of conviction behind the move.
- Relative Strength Index (RSI): The RSI helps determine if the market is overbought or oversold. In a continuation pattern, the RSI can confirm that momentum remains intact without hitting extreme levels. For instance, an RSI reading above 50 during a bullish continuation suggests there's still room for the trend to extend.
- Fibonacci Retracement: Traders use Fibonacci levels to identify potential retracement points during a trend. If a continuation pattern forms near a key Fibonacci level (like 38.2% or 61.8%), it can signal a strong resumption of the trend.
- On-Balance Volume (OBV): OBV measures the flow of volume in relation to price movement. If OBV aligns with the direction of the trend during a continuation pattern, it confirms the likelihood of trend continuation.
Final Thoughts
Analysing candlestick continuation patterns helps traders assess if trends are likely to persist. With clear rules, these patterns can be spotted on price charts, like those in FXOpen’s advanced TickTrader platform, and assist in determining entry and exit points.
Ready to incorporate continuation patterns into your strategy? Open an FXOpen account today and trade with tight spreads and low commissions. Good luck!
FAQ
What Are Continuation Candlestick Patterns?
Continuation candlestick patterns are chart formations that indicate a current price trend is likely to continue rather than reverse. These patterns appear during a pause in the trend, signalling that the market is consolidating before resuming its prior direction.
What Is the Bearish Continuation Pattern?
Bearish continuation patterns form when a downward price trend pauses temporarily before continuing lower. Examples include the downside tasuki gap and falling three method, which suggest sellers still dominate and the market will resume its downward momentum.
What Is the Japanese Candlestick Continuation Pattern?
Japanese candlestick continuation patterns are specific formations on candlestick charts that indicate the ongoing strength of a trend. Originating from traditional Japanese trading methods, they are widely used to confirm whether bullish or bearish market trends will persist.
This article represents the opinion of the Companies operating under the FXOpen brand only. It is not to be construed as an offer, solicitation, or recommendation with respect to products and services provided by the Companies operating under the FXOpen brand, nor is it to be considered financial advice.
Stay ahead of the market!
Subscribe now to our mailing list and receive the latest market news and insights delivered directly to your inbox.


Latest articles

Weekly Market Insights with Gary Thomson: US Inflation, UK GDP, Chair Warsh Testimony, and Earnings
In this video, we’ll explore the key economic events and market trends, shaping the financial landscape. Get ready for insights into financial markets to help you navigate the week ahead. Let’s dive in!
In this episode of Market

GBP/AUD Analysis: The Tug-of-War Begins
Oil is back in the driver's seat, and both the pound and the aussie are feeling its grip. The Bank of England held rates at 3.75% in June, but with UK inflation at 2.8% and crude oil climbing

Australian Dollar Holds Above the Current Market Profile
The minutes from the Reserve Bank of Australia's (RBA) June meeting, released on 30 June, suggested that policymakers are not yet ready to rule out further policy tightening. Board members noted persistent excess demand and broad-based inflationary pressures across the