


Countertrend Impulse Strategy
FXOpen

Countertrend trading is a well-respected way to trade. Combining it with the predictive power of impulse movements can help traders act on market reversals. This article delves into the components and practical application of this strategy, providing insights for any trader looking to enhance their trading skills.
Understanding Countertrend Trading
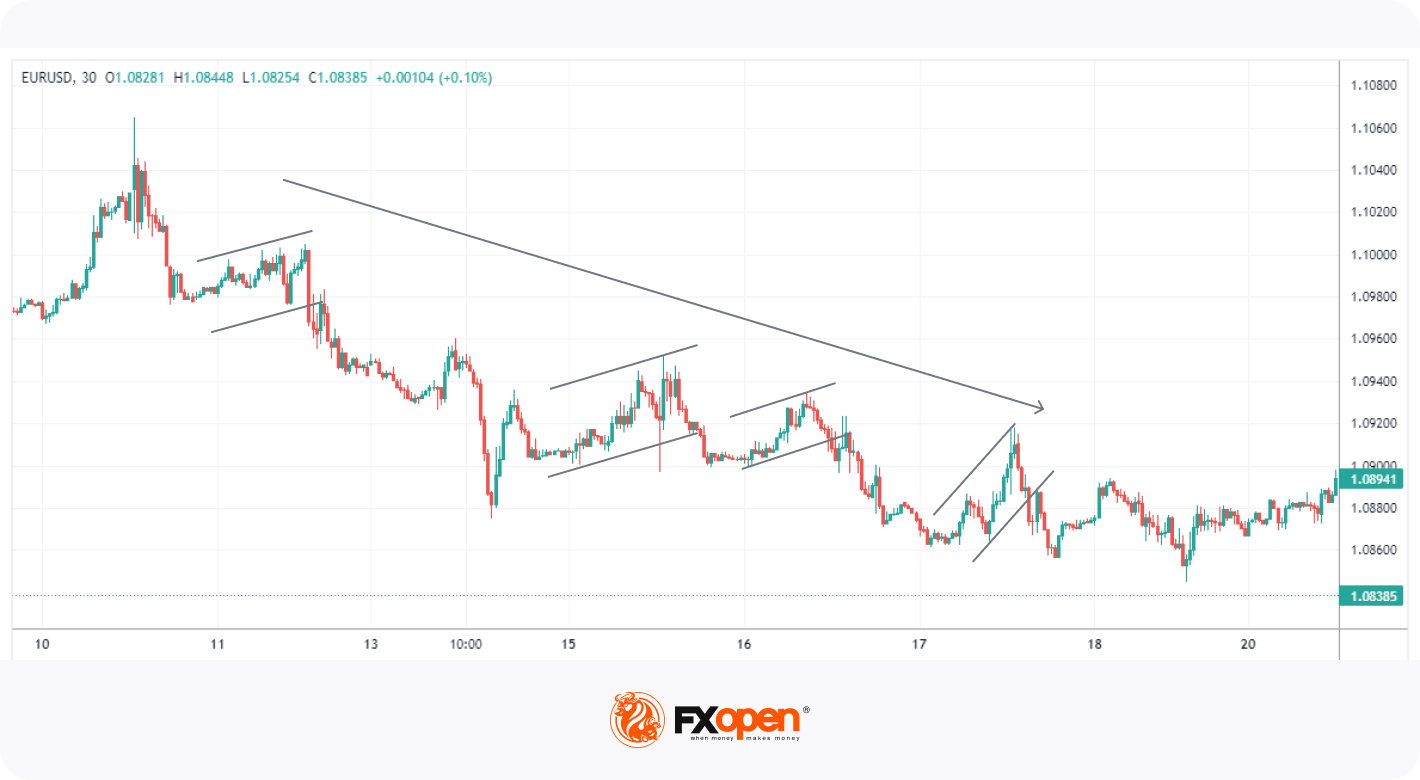
In trading, a trend represents the general direction in which a market or asset is moving. Trends are either upward, downward, or sideways. Countertrend trading, on the other hand, involves taking positions that are opposite to the prevailing trend.
Recognising countertrends is vital, as they provide new opportunities in the market. Traders look for signals that a trend might be losing momentum, such as weakening volume or specific candlestick patterns. They then seek opportunities to profit from the anticipated reversal.
Basic techniques to identify countertrends include using tools like moving averages, Relative Strength Index (RSI), and trendlines. By understanding and identifying countertrends, traders can position themselves to capitalise on potential market shifts, making it a fundamental aspect of various trading strategies.
Impulse Strategies: An Overview
An impulse strategy focuses on identifying and trading based on momentum changes within the market. An impulse in the market is a sudden and strong move in a particular direction, often triggered by news or fundamental events.
The key elements of impulse strategies include identifying a sudden movement, analysing its underlying cause, and predicting how it might impact future price action. Traders often look for candlestick patterns, like engulfing candles, and momentum indicators, such as the Moving Average Convergence Divergence (MACD), to gauge these impulses.
Integrating countertrend trading with an impulse strategy offers a method to identify when a reversal has weight behind it. It builds upon the foundational principles of recognising countertrends by adding a focus on sudden and significant market moves. This combination allows traders to recognise both gradual shifts and sudden changes in market direction.
Impulse-Based Countertrend Trading Strategy
This strategy involves a nuanced approach that combines the principles of countertrend trading with the detection of market impulses. Here's how it can be applied practically.
To try your hand at applying this setup for yourself, head over to FXOpen’s free TickTrader platform. There, you’ll find all of the trading tools and indicators you need to countertrend trade.
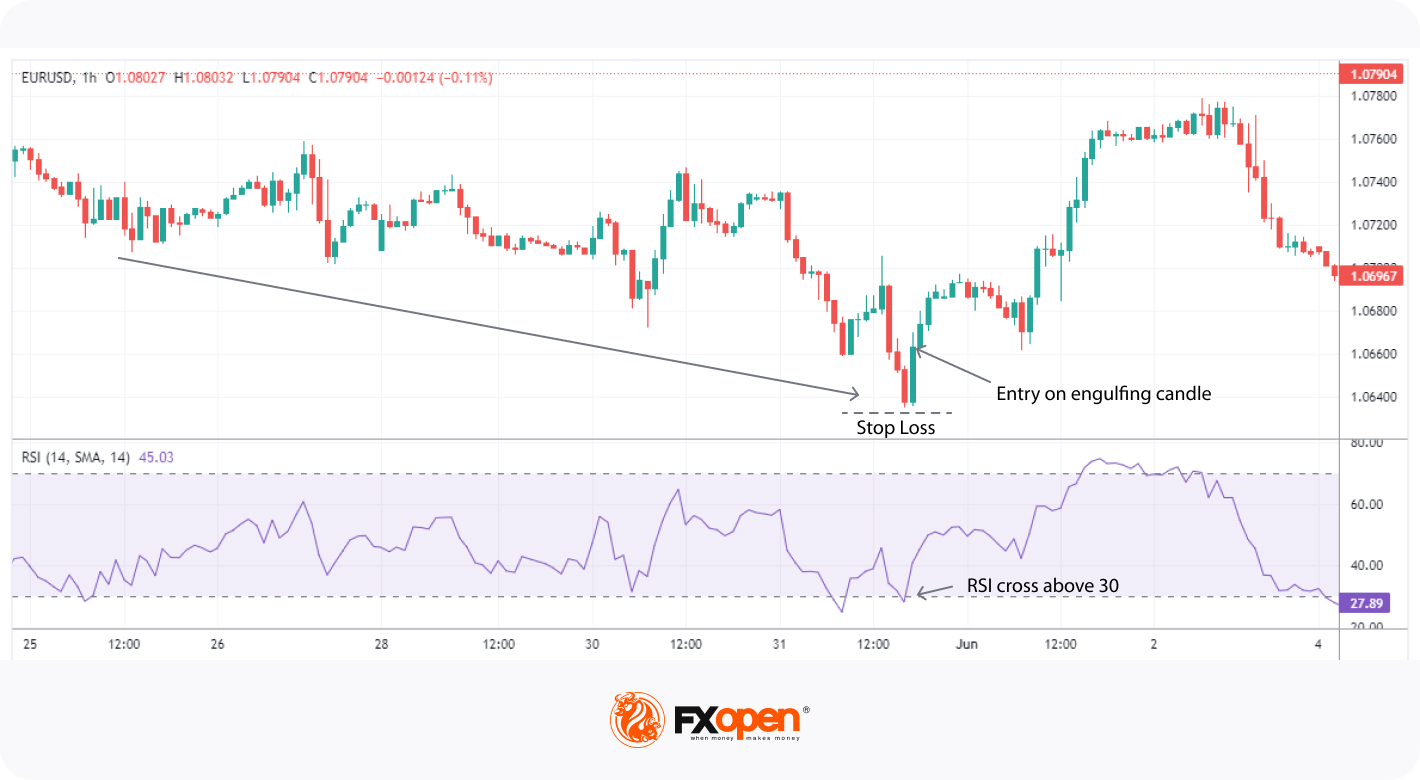
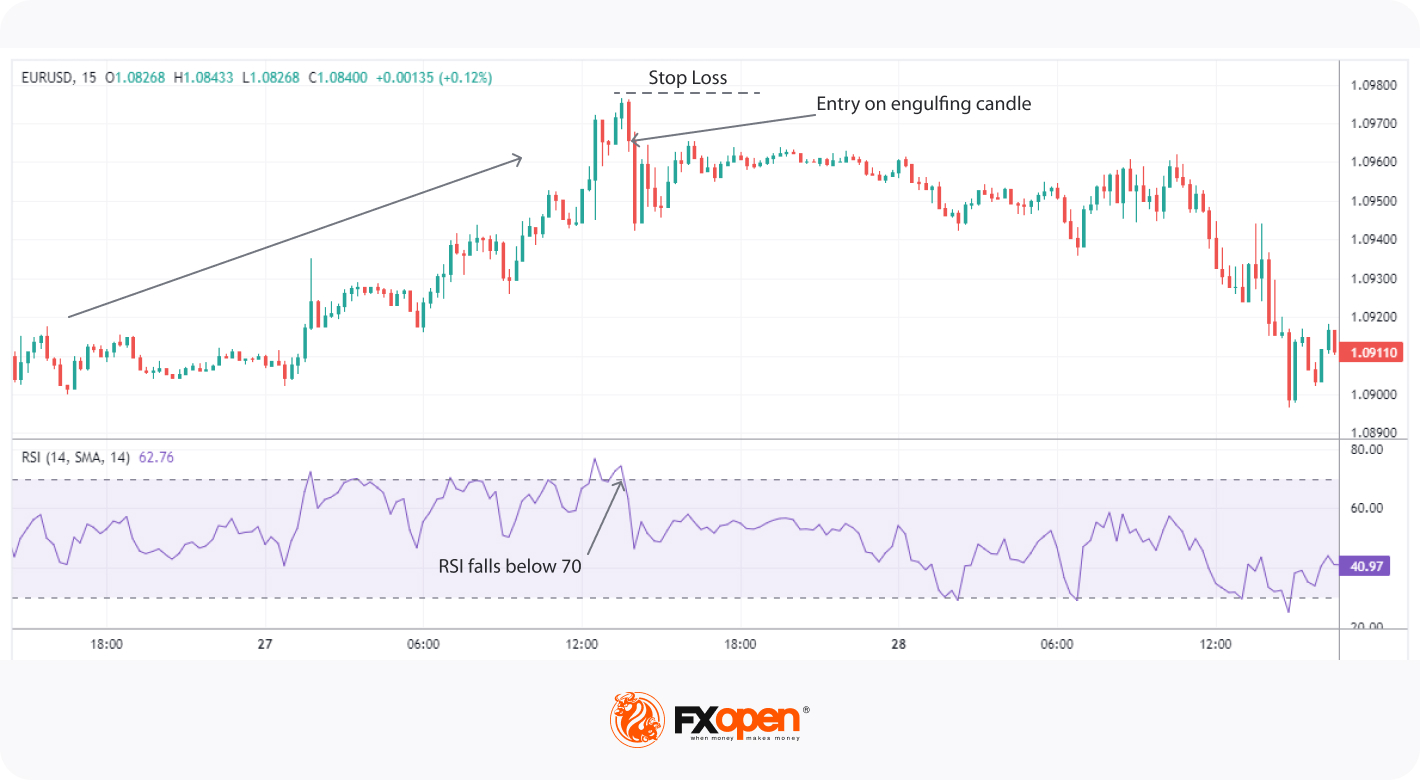
- Identifying Overbought/Oversold Areas Using RSI: Traders use the Relative Strength Index (RSI) to determine when an asset is overbought (above 70) or oversold (below 30). If there's a divergence between the RSI and price, it adds further confluence, although it's not a necessary condition.
- Looking for Specific RSI and Candle Patterns: The strategy becomes actionable when the RSI moves back above 30 or below 70, coupled with an engulfing candle that is noticeably larger than the previous few candles. This pattern indicates a strong impulse against the prevailing trend.
- Setting Stop Losses: A stop loss is placed above or below a nearby swing point, usually just before the impulse. This protects the position if the anticipated reversal doesn't materialise.
- Taking Profits at Support and Resistance Levels: Profits are taken at nearby support and resistance levels. Traders often aim to gradually scale out of their position, allowing flexibility in response to market movements.
Risks and Benefits of Countertrend Trading
countertrend trading can offer opportunities for profit, but it's important to understand both the risks and benefits involved in this approach:
Benefits
- Opportunity in Reversals: Identifying and trading reversals can yield profits in otherwise overlooked market situations.
- Diversification: Adding countertrend strategies to your arsenal may offer diversification benefits.
Risks
- Potential for False Signals: Countertrend trading might identify a reversal that does not materialise, leading to losses.
- Challenging Timing: Accurate timing of the market reversal requires skill and experience, and errors can be costly.
- Increased Volatility Exposure: This strategy might expose traders to increased volatility, making risk management vital.
The Bottom Line
In essence, combining countertrend trading with impulsive movements in the market can be an effective strategy. While it goes contrary to the typical advice of “the trend is your friend,” with the right setup, it can offer a way to capitalise on unique market opportunities.
For anyone interested in employing these strategies, opening an FXOpen account can be a good first step toward putting these techniques into practice. You’ll gain access to a wide range of markets to deploy your skills and benefit from competitive trading costs and rapid execution speeds. Good luck!
This article represents the opinion of the Companies operating under the FXOpen brand only. It is not to be construed as an offer, solicitation, or recommendation with respect to products and services provided by the Companies operating under the FXOpen brand, nor is it to be considered financial advice.
Stay ahead of the market!
Subscribe now to our mailing list and receive the latest market news and insights delivered directly to your inbox.


Latest articles

NZD/USD Analysis: A Tug-of-War at the Critical Level
The kiwi has strengthened meaningfully against most peers this month. However, against the US dollar specifically, NZD/USD remains well below its 2026 highs, trading in the mid-0.58 area versus January's peak near 0.6075.
New Zealand's Q2 inflation

AUD/USD and USD/CAD React to Rising Geopolitical Risks
Commodity-linked currencies remain under pressure as geopolitical tensions in the Middle East continue to escalate. The United States has maintained strikes on targets in Iran, while the Tehran-backed Houthis have intensified threats to shipping in the Red Sea and near

GBP/CHF: Trendline or RSI — Which One Is Lying?
Sterling enters this week on firmer footing, with political uncertainty fading fast after Andy Burnham's confirmation as Labour leader eased investor concerns over the succession to Keir Starmer. Markets reacted further to reports pointing to Shabana Mahmood as the frontrunner