


Crypto Market Falls Below $100 Billion
FXOpen

The combined crypto-currencies market cap fell below $100 billion yesterday as we saw large losses across the board. Bitcoin fell against the US Dollar and almost all altcoins fell versus bitcoin, leading to the market cap declining from a high of over $115 billion last week to ‘only’ $92 billion at the moment.
Bitcoin Remains in Range
Bitcoin is currently quoted at $2,397 on FXOpen, down $280 dollars from last Tuesday. In percentage terms, this is just over 10%. On the chart below we can see that the majority of the losses transpired during the past three days. We had no major news releases during this time so we can chalk up the latest down move to technical reasons.
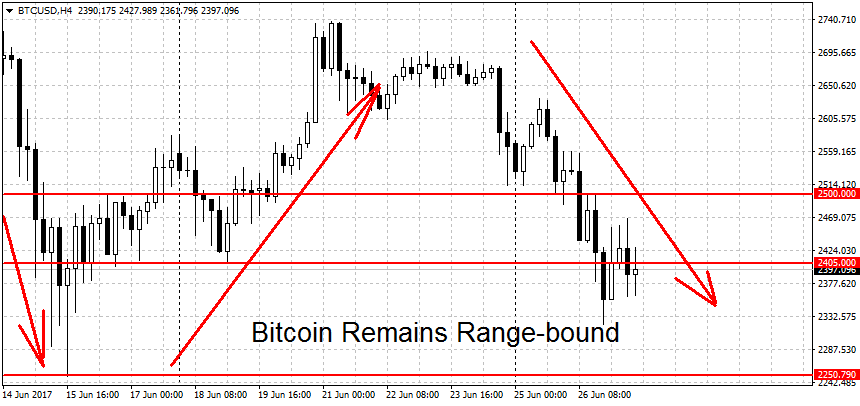
The move lower doesn’t change the technical picture, not yet anyway. On the daily charts, BTC/USD is still in a range. A new downtrend requires a break below the $2,250 swing low while a new uptrend needs a move above the all-time highs. These are at $2,889 on FXOpen but closer to the $3,000 on other major exchanges.
Below current prices, we find support at the $2,000 round figure and the $1,718 swing low. On the longer-term timeframes, both weekly and monthly, bitcoin fx remains in an uptrend. However, keep in mind that it will take many red weeks/months to change the trend on these timeframes.
Litecoin Falls From Highs
Litecoin didn’t manage to make headway in its most recent breakout. On June 19th a high of $49.47 was hit but we are currently trading at $35.88 on FXOpen, over 27 percent down from the highs.
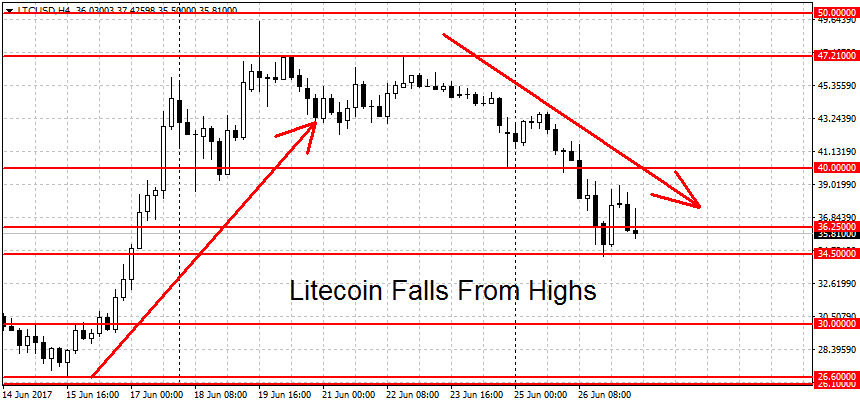
So far the $34.50 breakout point is holding up prices. Yesterday prices bounced close to this level, bottoming out at $34.35 dollars per coin. A decisive breakout below the $32 dollars level would end the current uptrend. Support below here can be found at the $30 round figure, followed by a ‘double bottom’ support area around $26. A breakdown below here could start a new LTC downtrend.
Given that we’re still trading relatively close to all-time highs, there’s not much in terms of resistance on the upside. Above current prices, there’s some resistance at the $40 round figure and the $47.21 swing high, followed by $49.47. And of course, the $50 round figure will be a major level to watch. A clean breakout above here could lead to extended gains. Similarly to bitcoin, on the long-term charts, LTC remains in bullish mode.
FXOpen offers the world's most popular cryptocurrency CFDs*, including Bitcoin and Ethereum. Floating spreads, 1:2 leverage — at your service (additional fees may apply). Open your trading account now or learn more about crypto CFD trading with FXOpen.
*Important: At FXOpen UK, Cryptocurrency trading via CFDs is only available to our Professional clients. They are not available for trading by Retail clients. To find out more information about how this may affect you, please get in touch with our team.
This article represents the opinion of the Companies operating under the FXOpen brand only. It is not to be construed as an offer, solicitation, or recommendation with respect to products and services provided by the Companies operating under the FXOpen brand, nor is it to be considered financial advice.
Stay ahead of the market!
Subscribe now to our mailing list and receive the latest market news and insights delivered directly to your inbox.


Latest articles

EUR/USD and GBP/USD consolidate ahead of the Fed decision
European currencies are showing subdued dynamics, entering a consolidation phase following their previous advance. Earlier, EUR/USD and GBP/USD broke out of their ranges and strengthened; however, the subsequent correction has led both pairs to retest the previously breached

Meta: V-Shaped Recovery Meets Heavy Volume Resistance
The movement in Meta Platforms shares is being driven by two competing narratives. On one hand, advertising revenue is benefiting from AI-based tools: the Advantage+ platform continues to support strong advertiser demand, and the analyst consensus for Q1 2026 revenue

Commodity Currencies Test Key Levels Ahead of Major Macro Data
Commodity-linked currencies are trading near key levels, showing restrained price action as market participants adopt a wait-and-see approach. The fundamental backdrop is shaped by expectations surrounding the release of Australia’s inflation data and the Bank of Canada’s interest