


Cryptocurrency Chart Analysis
FXOpen
Cryptocurrency has come a long way since the days of purchasing pizza with BTC. Timing is a critical factor that traders must keep in mind. Due to the volatile nature of the crypto market, your ability to make good decisions quickly may significantly impact your trades.
Therefore, it becomes necessary to explore crypto charts. These graphical representations highlight a digital asset's trends and momentum and help traders forecast future price movements.
What Is the Significance of Cryptocurrency Chart Analysis?
Charts, in simpler terms, are historical records of market behaviour. They represent market sentiments and fundamental dynamics within a trading period. Crypto chart analysis is a skill that equips traders with comprehensive information related to market dynamics. Analysis of historical price data, support/resistance levels, and patterns can help traders anticipate the potential price movement of a crypto asset. Therefore, your ability to recognise patterns and interpret charts becomes critical.
What Charts Are Best for Crypto Analysis?
There are various types of crypto charts; understanding their key features and strengths plays a significant role in cryptocurrency analysis. Different charts offer something unique that may influence the depth of insight gained by traders. Here are some chart types that you could use for crypto analysis:
Candlestick Charts
Candlestick charts are among the most popular types. Traders can use these to identify price movements and market patterns. Each candlestick represents a certain timeframe and has four components. They are:
- Opening price
- Closing price
- Highest price
- Lowest price
Additionally, the body of the candlestick is shaded to highlight the price range between the opening and closing prices. The price range between the high and low prices is illustrated by a line, also known as the shadow or wick. One unique feature of candlestick charts is that they provide in-depth insight into potential trend continuations or reversals.
Line Charts
Line charts are a simple yet highly effective way to measure price trends within a period. They work by connecting the closing prices of a crypto asset with a continuous line. Over time, you can get a clear vision of the price direction of that cryptocurrency. Traders may benefit from using line charts because they are simple to understand and can quickly illustrate long-term price trends. So, if your focus is on understanding broader market sentiments and general price direction, you can consider line charts.
Heikin Ashi Charts
Heikin Ashi charts are like a more complex form of candlestick charts. These charts incorporate a smoothing mechanism that reduces the effect of price volatility. Each Heikin Ashi candlestick is calculated based on a concept that considers the previous candle’s open, close, high, and low prices. As a result, we get a chart that provides a better representation of price trends.
Heikin Ashi charts are unique because they help traders filter noise and focus on trend direction. Additionally, they illustrate more stable patterns and trends by minimising the effect of short-term price volatility.
Crypto Graph Analysis Techniques
Traders can adopt various techniques for crypto graph analysis. You can visit TickTrader to get a comprehensive view of the best live crypto charts.
Technical Analysis
Technical analysis is a critical aspect of interpreting crypto graphs. It involves using indicators and patterns to identify cryptocurrency trends and forecast potential price movements. The principles of the Dow Theory guide technical analysis.
Charles Dow, one of the founders of Dow Jones & Company and co-founder of The Wall Street Journal, came up with the theory that laid the foundation for technical analysis and influenced many subsequent methodologies. The Dow Theory emphasises that prices already incorporate everything known or knowable about the market.
Fundamental Analysis: Impact of News on Charts
While technical analysis focuses on market price movements, fundamental analysis deals with external factors that affect these fluctuations. Here are some of the factors that can influence the price movement of the crypto market:
- News and updates
- Technological advancements
- Regulations, which depend on the government
- Macroeconomic events
- Partnerships and collaborations
- Use case of the crypto token and network
Sentiment Analysis: Social Media and Market Sentiment
Sentiment analysis involves evaluating the emotions of the market participants. This can be done through sentiment analysis tools and social media. Sentiment analysis complements technical and fundamental analysis. Trader sentiment can play a significant role in influencing market dynamics and price trends.
For example, increasing positive comments on social media regarding a crypto asset may trigger a price uptrend. This is because it has caused an increase in demand for the crypto asset.
Essential Aspects of Crypto Trading
There are some essential aspects of cryptocurrency trading. You can open an FXOpen account to explore all these concepts and learn how they can make a difference in your trading.
Volumes
Volumes are an essential metric in crypto trading. They show the number of crypto assets traded within a certain period. When the trading volume is high, it signifies increasing interest and demand among traders. On the other hand, low trading volumes indicate a decreasing interest in that cryptocurrency.
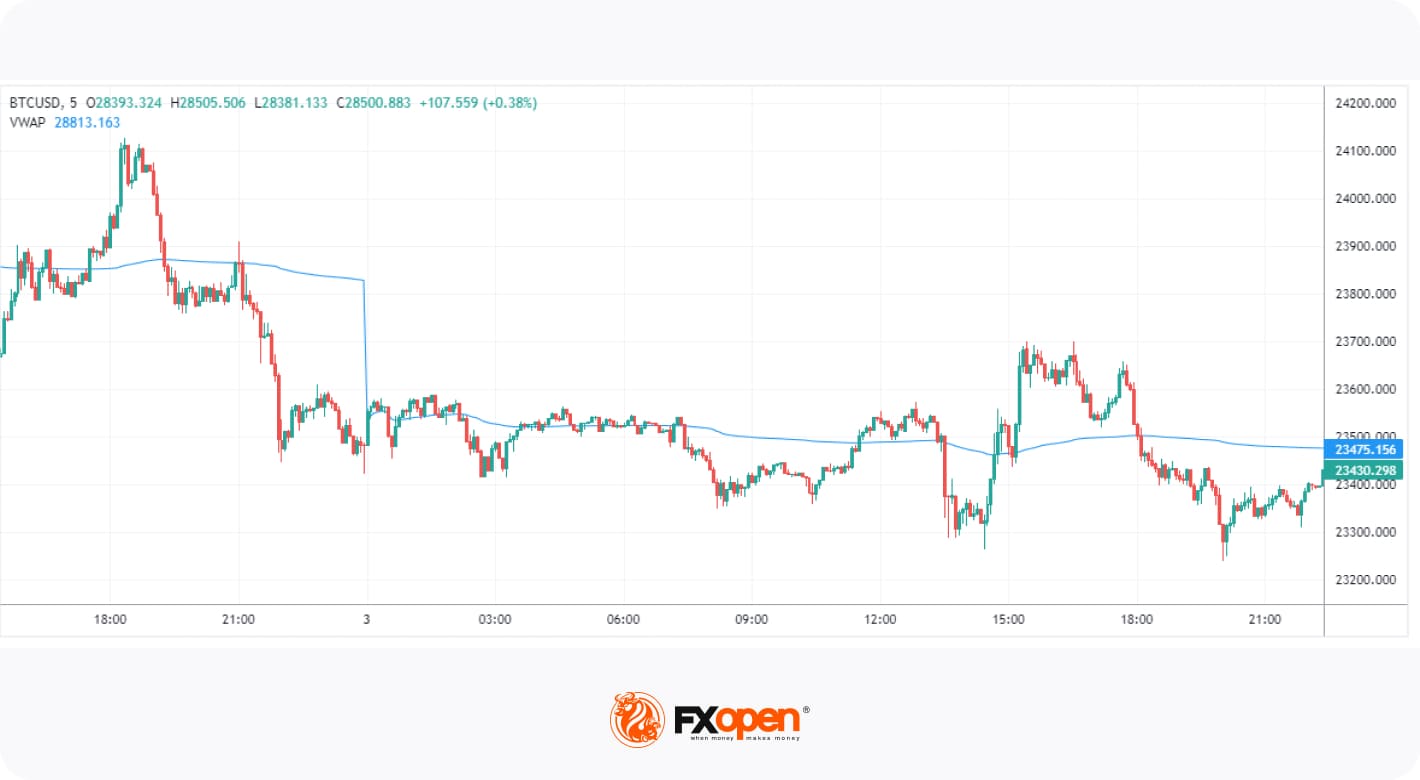
The most effective volume indicators include such tools as on-balance volume and volume-weighted average price (VWAP).
Volatility
Volatility is a measure of fluctuation in the price of a given market or asset within a timeframe. The crypto market is associated with high volatility, which can be an opportunity as well as a challenge for traders. Day traders often take advantage of this situation by taking small profits from price fluctuations throughout the day.
Bitcoin is a classic example of volatility in the market. The price of BTC at the beginning of 2018 was about $19,000 but quickly crashed to about $3,500 by December of the same year. Regardless of this crash, BTC was valued at $65,000 in 2021.
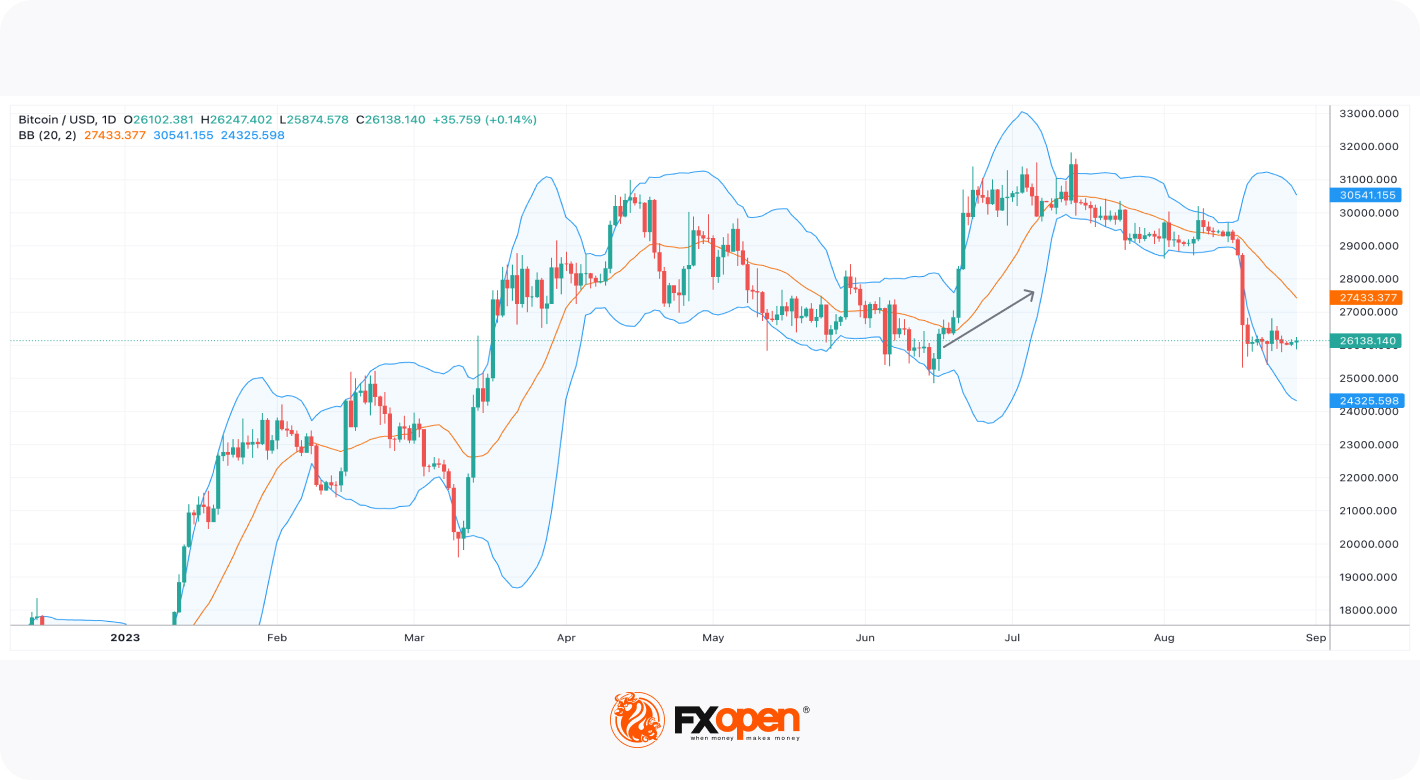
The most popular volatility indicators involve Bollinger bands and the average true range.
Cryptocurrency Trends
Another critical aspect is your ability to identify cryptocurrency trends. When traders can recognise the possible direction of an asset’s price, they can make informed decisions.
Trends refer to the general direction in which the price of a cryptocurrency is moving over a certain period. This fundamental concept allows traders to identify prevailing market sentiment to make informed decisions.
Trends can be described as bullish, bearish, or sideways. A bullish trend is characterised by a consistent increase in the price of a cryptocurrency. As a result, traders may buy or hold positions in anticipation of taking profit when the price increases further. On the other hand, a bearish trend suggests a negative market sentiment, which is characterised by a persistent decline in the price of a crypto asset. Traders can enter a short trade if they anticipate a future price decline. A sideway trend is one where the price remains fairly stable within a range, allowing traders to identify precise entry and exit points.
For example, if, over a certain period, the price of Dogecoin consistently registers higher highs, traders will see this as an uptrend. Therefore, traders may be prompted to buy more Dogecoin with the hopes that the price will continue to move upward.
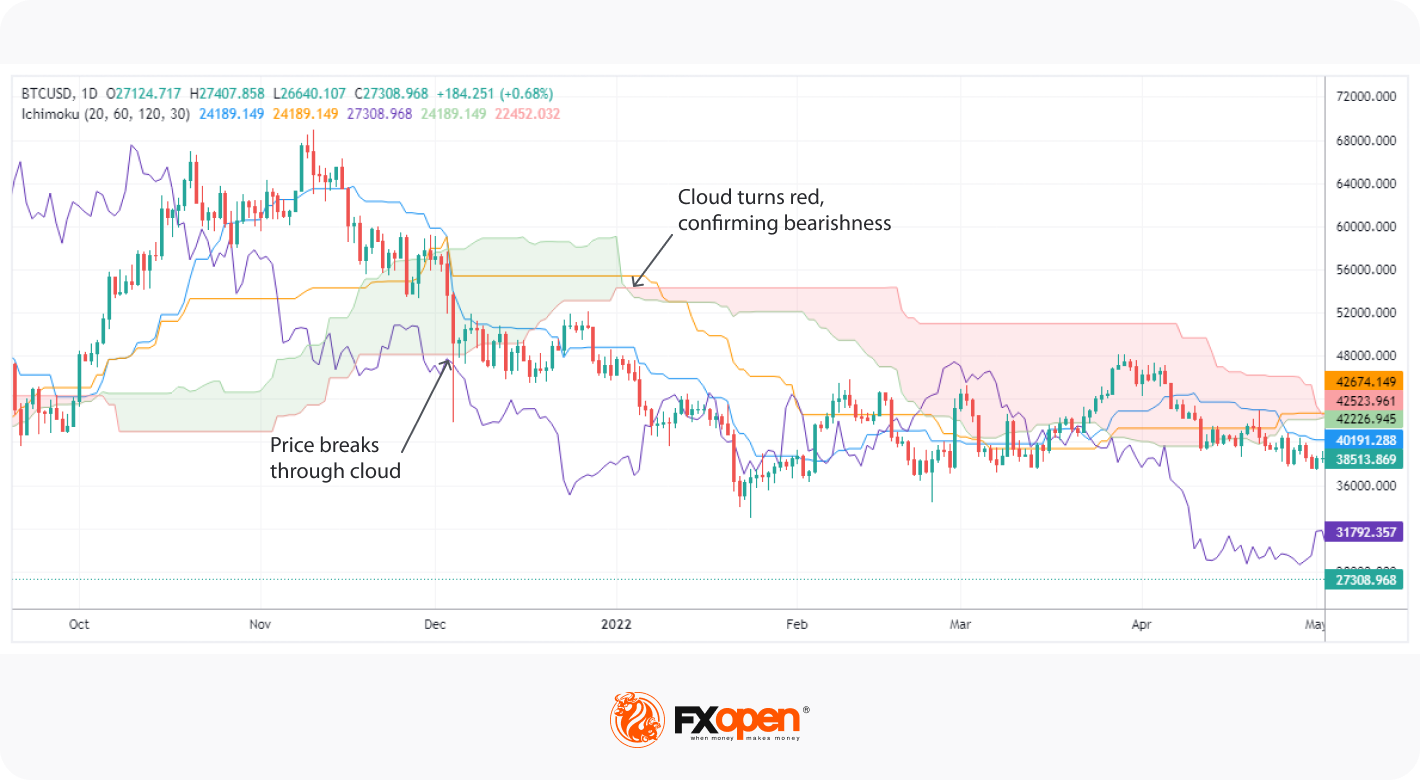
Traders widely use various trend indicators, including moving averages and the Ichimoku cloud.
Momentum
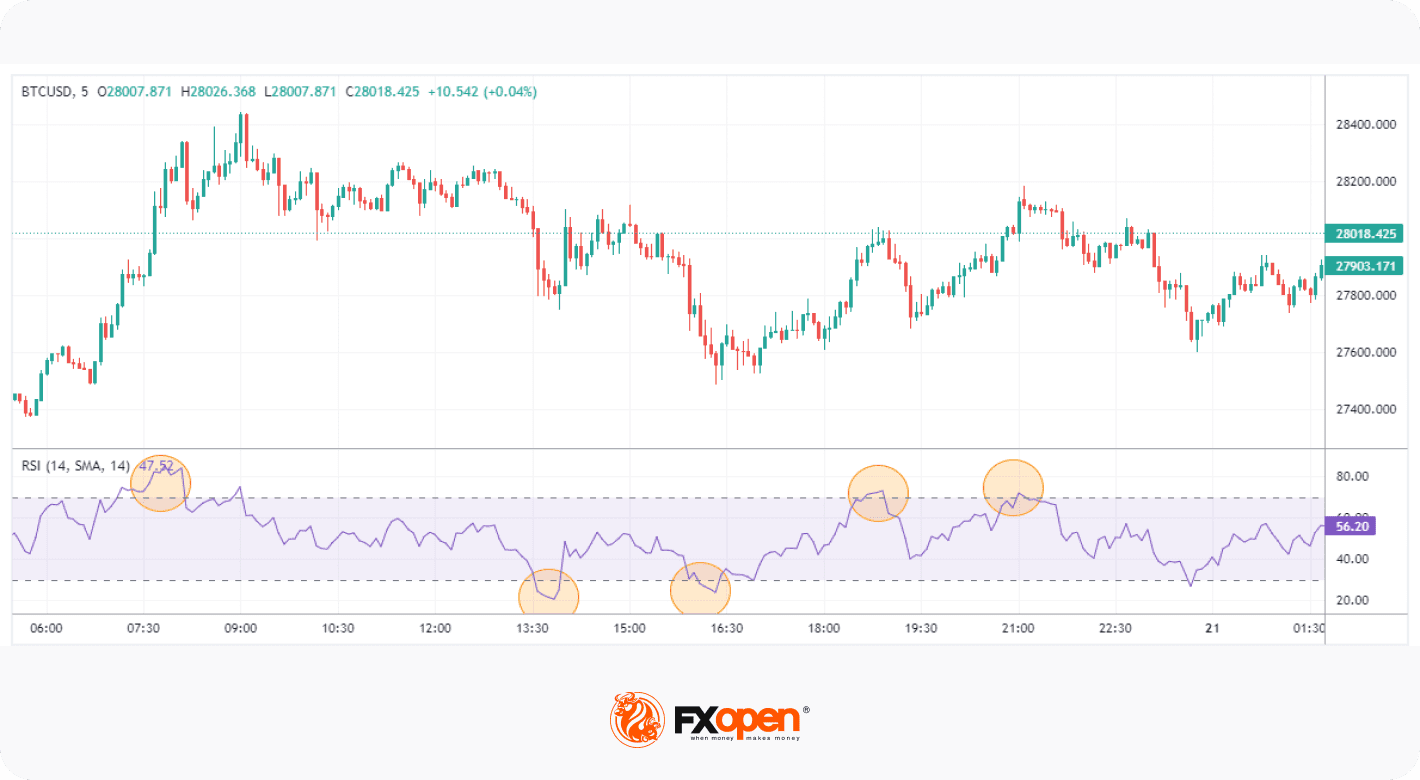
Momentum refers to the strength and speed of price movements over a specific period of time. It is a key concept in technical analysis and is used to assess the likelihood of a continued price trend or a potential reversal.
Momentum indicators on cryptocurrency charts help traders and analysts understand whether a price movement is likely to sustain its direction or if it might be losing steam. These indicators can be valuable tools for making trading decisions and managing risk. Here are a few commonly used momentum indicators:
The most prominent momentum indicators include RSI (Relative Strength Indicator), MACD (Moving Average Convergence Divergence), and the Stochastic oscillator.
Conclusion
Crypto chart analysis is a critical subject for traders. Technical, fundamental, and market sentiment analysis are techniques that can provide useful insights into market dynamics. Additionally, volumes, volatility, trends, and momentum are essential crypto concepts that traders should understand. You can visit the FXOpen website to get started!
At FXOpen UK and FXOpen AU, Cryptocurrency CFDs are only available for trading by those clients categorised as Professional clients under FCA Rules and Professional clients under ASIC Rules, respectively. They are not available for trading by Retail clients.
This article represents the opinion of the Companies operating under the FXOpen brand only. It is not to be construed as an offer, solicitation, or recommendation with respect to products and services provided by the Companies operating under the FXOpen brand, nor is it to be considered financial advice.
Stay ahead of the market!
Subscribe now to our mailing list and receive the latest market news and insights delivered directly to your inbox.


Latest articles

Gold Analysis: Is the Correction Over, or Just Catching Its Breath?
Gold has had a rough year. After hitting an all-time high near $5,602 in January, the metal has since dropped roughly 27% from that peak, weighed down by rising Treasury yields, a firmer dollar, and cooling demand for safe-haven

Brent Analysis: Oil Retreats from $100 as Saudi Arabia Proposes Maritime Coalition Initiative
On 23 July 2026, Brent crude rose above $100 amid reports of attacks on tankers and infrastructure in the Red Sea area, as well as strong statements from Donald Trump towards Iran over threats to shipping security through the Strait

Nasdaq 100: 48 Hours of Chaos, One Trendline Standing in the Way
Wall Street just lived through one of its wildest 48 hours of the year. On Wednesday, the Fed held rates steady at 3.50%-3.75%, but three FOMC members broke ranks to demand a hike—an unusually hawkish dissent