


Dash at Support, Ether Bounces From Lows
FXOpen

Alternative crypto-currency Dash has been trading right above an important support level all month. Ether on the other hand had a wild ride, first plunging to a new low of 0.00775, only to rally back up to 0.01152.
Ether Bounces From Lows
Ether had an interesting two weeks since our last update. The crypto initially continued the trend lower, moving below the 0.01 figure on December 2nd. Then a hack of a prominent ETH investor sent prices crashing and on December 6th a low of 0.00775 was hit. From here we got a bit of a reversal, with ETH/BTC rallying to 0.01152, almost matching the month’s high at 0.01166.
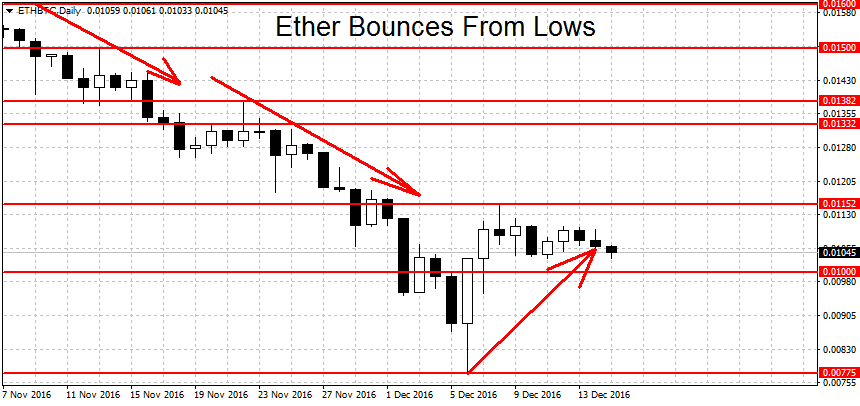
One coin is selling for 0.01045 right now. Despite the gains, ETH/BTC is still technically in a downtrend. To end it, a decisive break above the 0.01152 swing high is needed. Notable resistance above here can be found at the October lows of 0.01332. A break of this level could shift the trend to the upside. Higher still we have more levels at 0.01382 swing high followed by the 0.015 round figure.
On the lower end we have support at the 0.01 round level followed by this month’s swing low at 0.00775. The semi-round figure at 0.05 may offer some support as well.
Dash Trading at Support
Dash has been trading near the important support level of 0.0111 during all of December. Earlier this month we traded as low as 0.01103 but this move lower was quickly repelled so it can’t be classified as a break of the level. Like we always say, we’re looking for a decisive break, not a short or shallow move below the level.
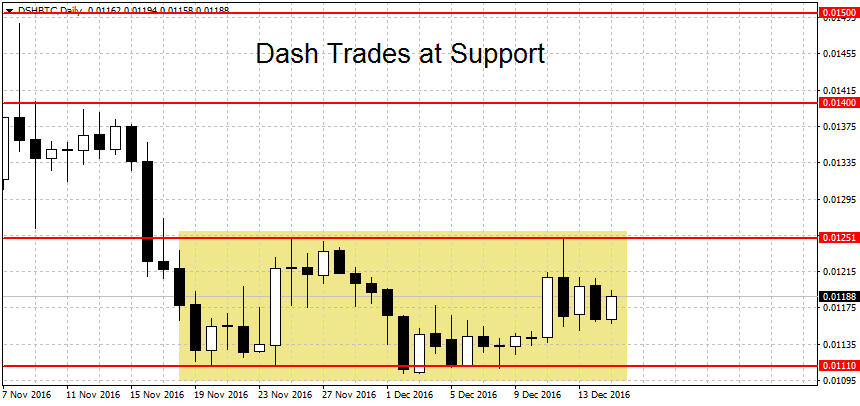
We’re now quoted at 0.01188 BTC per coin. As you can see in the daily chart above, prices are still trading in a range (marked with the yellow rectangle). On the lower end, we have now formed a triple bottom pattern, with lows on October 29th, November 20th and most recently, December 2nd. A decisive break below the low at 0.011 would invalidate the pattern and restart the downtrend. Close to here, we have support at the 0.01 round figure.
On the other end, a breakout above this month’s high at 0.01251 would confirm the triple bottom formation and potentially start a rally in prices. Above here we find several resistance levels at 0.014 and the 0.01489 swing high, which is closely followed by the round figure at 0.015. We have more resistance above here at the September lows of 0.01741 BTC.
FXOpen offers the world's most popular cryptocurrency CFDs*, including Bitcoin and Ethereum. Floating spreads, 1:2 leverage — at your service (additional fees may apply). Open your trading account now or learn more about crypto CFD trading with FXOpen.
*Important: At FXOpen UK, Cryptocurrency trading via CFDs is only available to our Professional clients. They are not available for trading by Retail clients. To find out more information about how this may affect you, please get in touch with our team.
This article represents the opinion of the Companies operating under the FXOpen brand only. It is not to be construed as an offer, solicitation, or recommendation with respect to products and services provided by the Companies operating under the FXOpen brand, nor is it to be considered financial advice.
Stay ahead of the market!
Subscribe now to our mailing list and receive the latest market news and insights delivered directly to your inbox.


Latest articles

US Dollar Strengthens Amid Equity Market Weakness and Hawkish Fed Rhetoric
The US dollar continues to hold firm near multi-year highs as sentiment across equity markets deteriorates and investors increasingly expect the Federal Reserve to maintain a restrictive monetary policy stance for longer. The US economy remains resilient, while inflation risks

Bitcoin: Corrective Channel Broken as Traders Turn More Active
Bitcoin has come under the influence of several factors simultaneously. The wave of selling at the beginning of June was linked to Strategy's first disclosed Bitcoin sale in several years, a prolonged series of outflows from spot ETFs, and a

DAX 40: consolidation amid technology sell-off
A wave of selling in the technology sector that emerged earlier this week has weighed on European equities. The trigger was investor concern over the profitability of large-scale debt-funded investments by major US tech companies in AI infrastructure. The Nasdaq