


Difference Between Heikin Ashi and Candlestick Charts
FXOpen
When it comes to understanding market trends, two popular charting methods stand out: Heikin Ashi and candlesticks. These visual tools allow traders to understand price movements and look similar, but they use different approaches. In this FXOpen article, we will explain the main difference between Heikin Ashi and candlestick charting. Learn their specifics to navigate the world of trading.
What Is the Difference Between Heikin Ashi and Candlestick Charts?
Heikin Ashi bars and candlesticks are used by traders to analyse price trends and predict future price movements. However, they present data in different ways. To compare candlestick vs Heikin Ashi, we first need to know what each of the techniques means and what it looks like.
Candlesticks
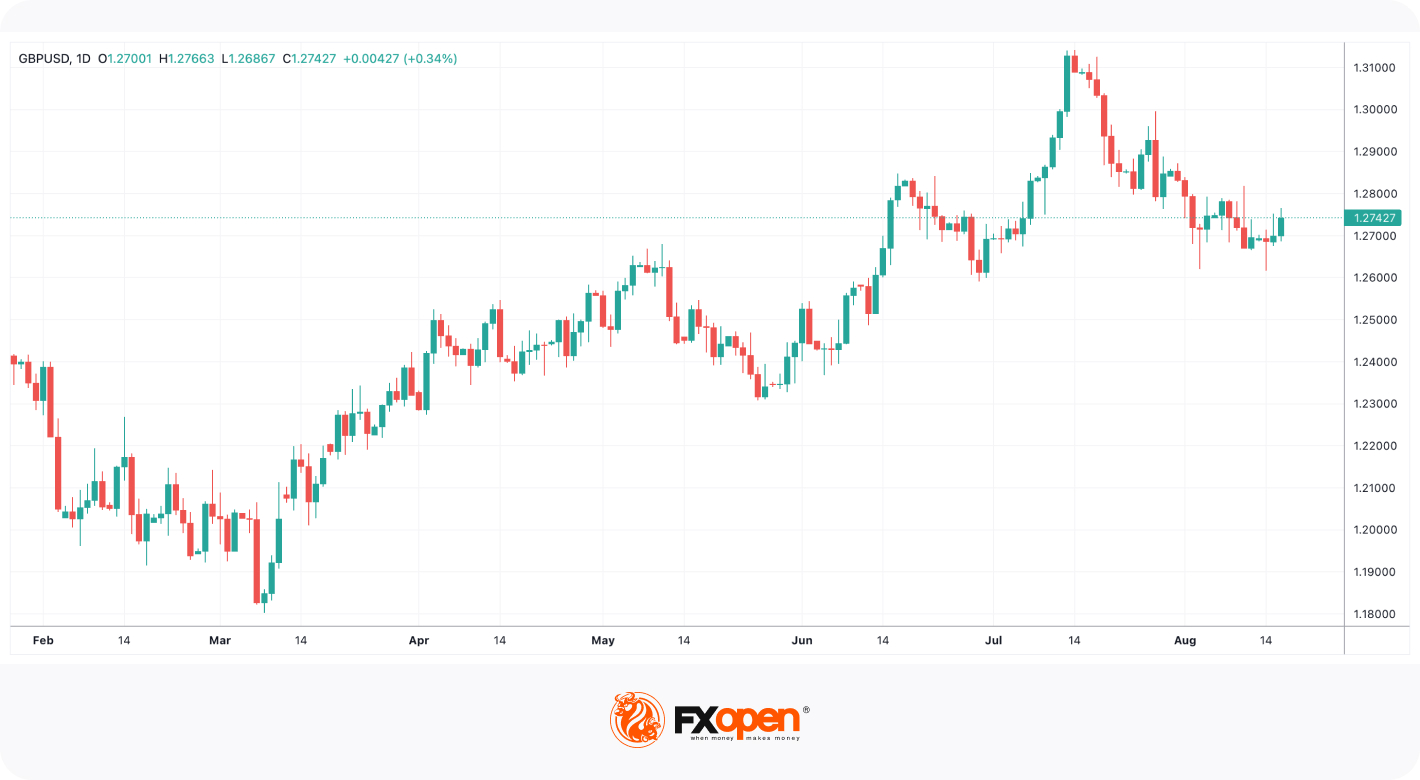
Candlestick charts are traditional for many traders. This technique uses individual candlesticks to depict price movements within a particular timeframe, whether it be a day or an hour. Each candle consists of four main components: open, close, high, and low prices. This means that on a daily timeframe, each candle will include open, close, high, and low prices for a day the market was opened at.
The body of the candle is coloured to show whether the value of an asset has increased or decreased over a given period of time. The wicks, or shadows, extend from the top and bottom of the body, representing the range between high and low prices.
Example: If the open price is lower than the close, the body is commonly green or white, which indicates bullish momentum. Conversely, if the open price is higher than the close, the body is typically red or black, signalling a bearish mood.
Heikin Ashi
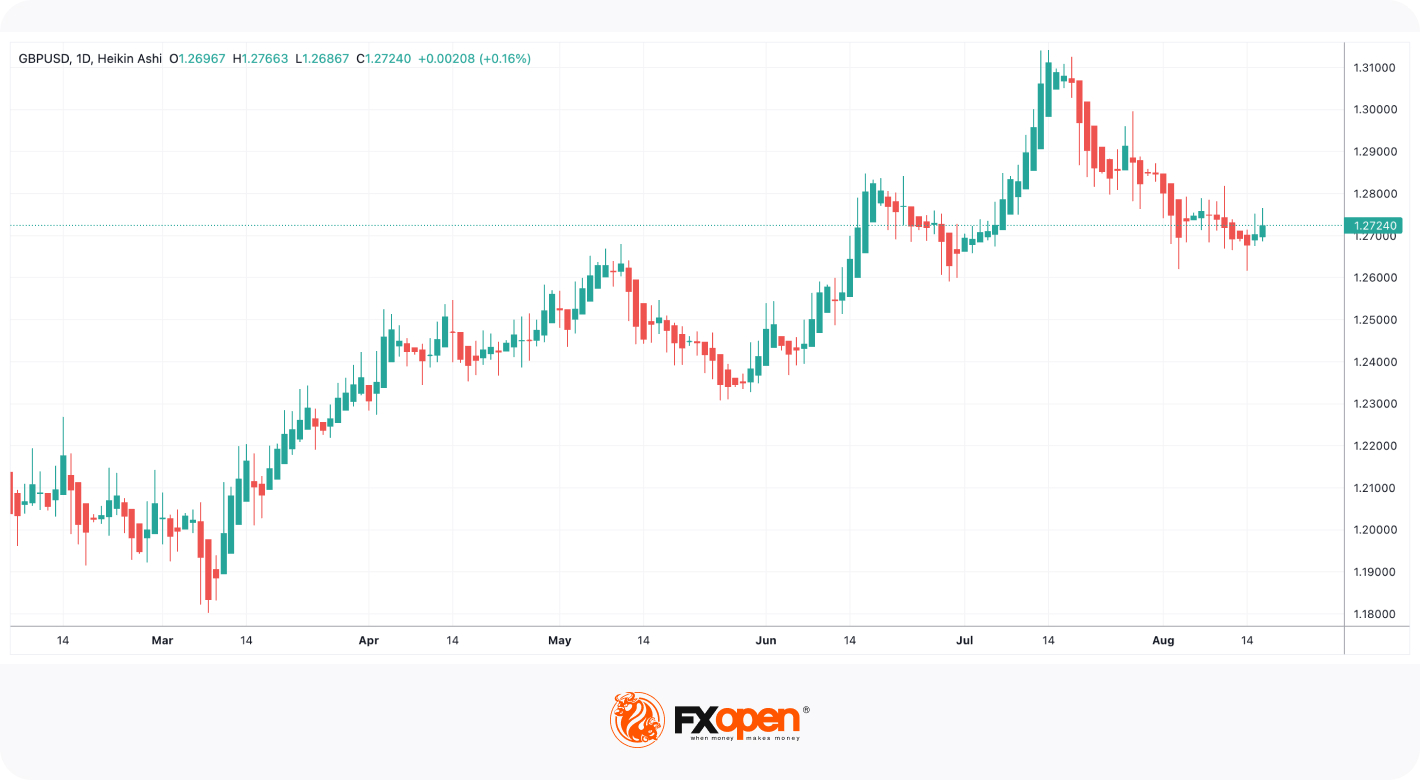
Heikin Ashi, which means “average bar” in Japanese, offers a unique perspective despite looking similar to candlesticks. Instead of displaying individual price points, Heikin Ashi charts use modified calculations to display trends more smoothly. Heikin Ashi candlesticks start forming from the middle of the previous candlestick. Such graphs help to filter out the noise and highlight the main trend.
The opening, closing, high, and low prices of each candle are determined using special formulas, resulting in a modified appearance of the candles. Here is a formula for a close-open-high-low:
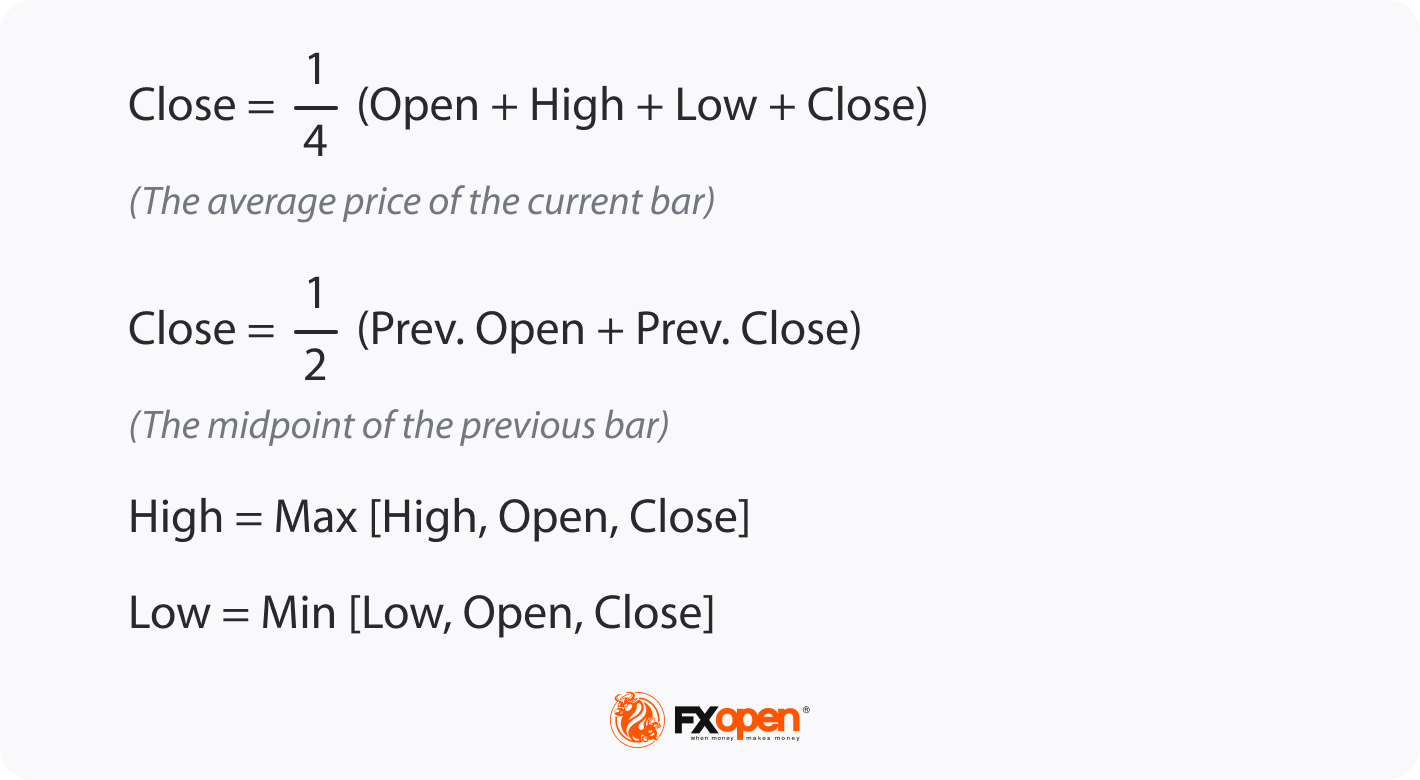
Example: On a Heikin Ashi, long downward candles that display minimal upper shadows indicate robust selling pressure, whereas extended upward candles featuring minor or no lower shadows indicate considerable buying pressure. Heikin Ashi bars make it easier to identify trends and reversals, as they are much smoother.
Heikin Ashi Candles vs Candlestick Charts: a Comparison Table
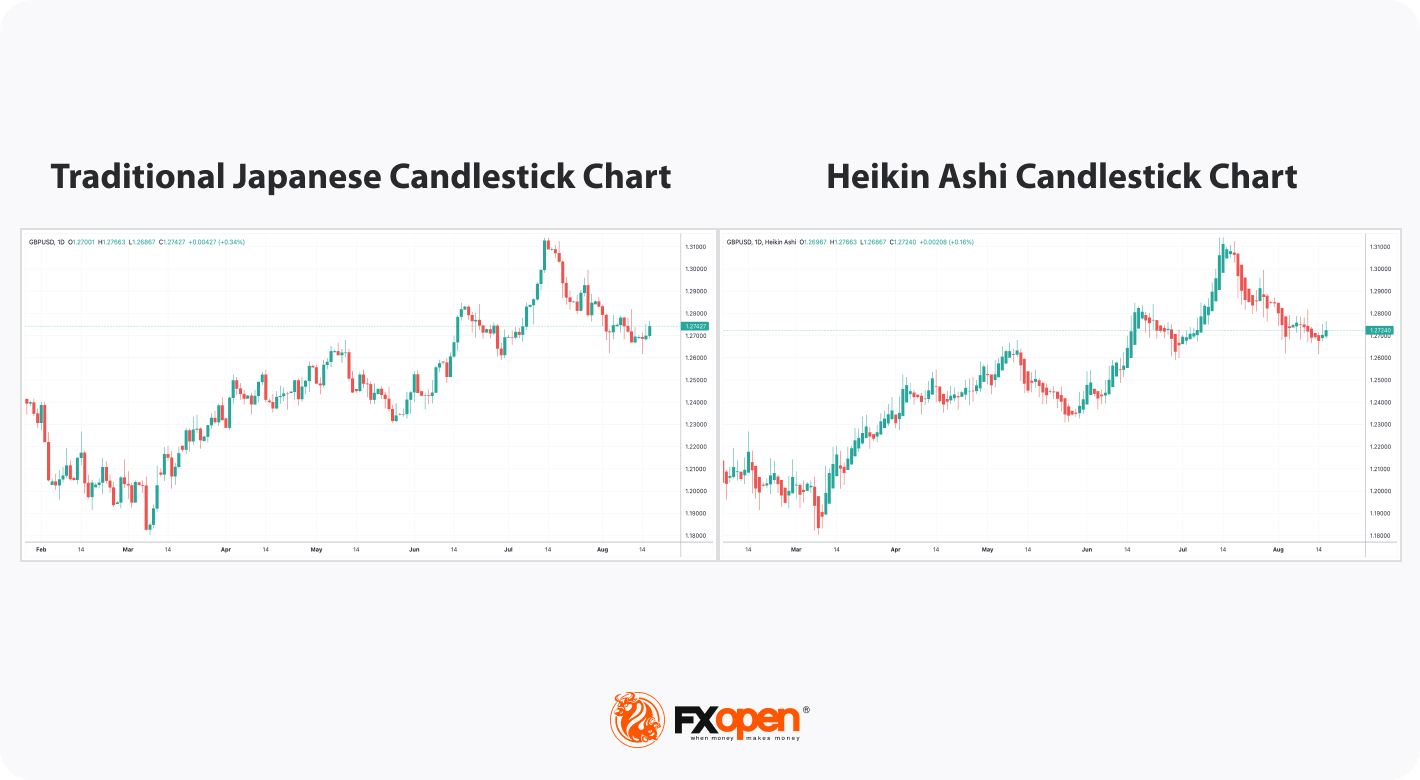
Now that you’ve seen what makes them unique, let’s look at how the two charting techniques differ fundamentally. We have put together a table with the differences, and below we have provided an image for a visual comparison.
Interestingly, although charting techniques have differences, similar patterns and trends can be spotted on them. However, it’s worth remembering that candlestick patterns won't be the same because charts are calculated differently. In this case, candlesticks are more often used by price action traders with short-term timeframes.
Note: Heikin Ashi and candlesticks are commonly used together to confirm signals.
Final Thoughts
In the candlestick vs Heikin Ashi debate, both charting methods have their merits. Candlesticks provide the raw data for in-depth analysis, while Heikin Ashi bars provide a simplified but more understandable view of trends.
Depending on your trading style and preferences, either method can help you make decisions. Experiment with both approaches and determine which one suits you best.
At FXOpen, we believe that understanding different charting methods is a valuable step towards improving your trading skills. Open an FXOpen account and explore our trading platforms — TickTrader, MT4, and MT5 — to learn more about the features that we offer.
This article represents the opinion of the Companies operating under the FXOpen brand only. It is not to be construed as an offer, solicitation, or recommendation with respect to products and services provided by the Companies operating under the FXOpen brand, nor is it to be considered financial advice.
Stay ahead of the market!
Subscribe now to our mailing list and receive the latest market news and insights delivered directly to your inbox.


Latest articles

Weekly Market Insights with Gary Thomson: The Week of Central Banks and Earnings
In this video, we’ll explore the key economic events and market trends, shaping the financial landscape. Get ready for insights into financial markets to help you navigate the week ahead. Let’s dive in!
In this episode of Market

Intel at a Crossroads: Earnings Beat Meets Technical Resistance
Intel has just delivered its strongest quarter in over fifteen years, and the market reaction says it all. Q2 2026 revenue surged 25% year-over-year to $16.1 billion, crushing the consensus estimate of $14.42 billion, while adjusted EPS of

Tesla: Complex Range Structure Breaks Down Following Quarterly Earnings
Tesla released its Q2 2026 results after the market closed on 22 July. Revenue increased 26% year-on-year to $28.24 billion, while vehicle deliveries reached a record 480,126 units. However, operating margin fell sharply to 1.4%, down from