


Elliott Wave Patterns: What Is a Zigzag Wave?
FXOpen
In the world of financial trading, the zigzag wave is a concept that often comes into play. It is a part of the technical analysis technique known as the Elliott Wave theory, which traders use to analyse and predict market price movements. It allows retail traders to filter market noise and make more accurate investment decisions. This article will show you what a zigzag is and how to use it on trading charts.
Elliott Wave Theory vs ZigZag
The Elliott Wave theory, from which the zigzag originates, was first presented by Ralph Elliott over a hundred years ago. He suggested that the market had its own rhythm and that it moved in ‘cycles.’ His theory assumes the existence of as many as eight waves of a full cycle, where five are upward and three are downward (in the case of an upward trend). In the case of a downward trend, the situation is reversed: the first five are downward, and the next three are upward. Elliott's theory provides a broader view of technical analysis and tries to present the market in a comprehensive way.
When analysing Elliott Wave vs zigzag, we must remember that the latter is an integral part of wave analysis and one of the basic setups on the chart. Although Elliott’s theory may initially seem complicated, it is worth getting to know it to broaden your analytical toolkit.
What Is a Zigzag Pattern in Trading?
The zigzag pattern in trading is a specific formation identified within the broader Elliott Theory. It is characterised by clear, distinct, and sharp price movements, which typically go against the larger trend. These movements are often corrective; hence the term Elliott wave zigzag correction is used to describe this setup.
The zigzag consists of three distinct parts: two impulse waves that move in the opposite direction of the dominant trend and one corrective wave that moves in the same direction. The impulse waves are labelled as 'A' and 'C', while the corrective one is labelled as 'B.’ The zigzag setup’s 'ABC' structure is one of its most defining characteristics.
Let’s use the TickTrader platform to present the zigzag setup. It offers advanced tools and features for retail traders:
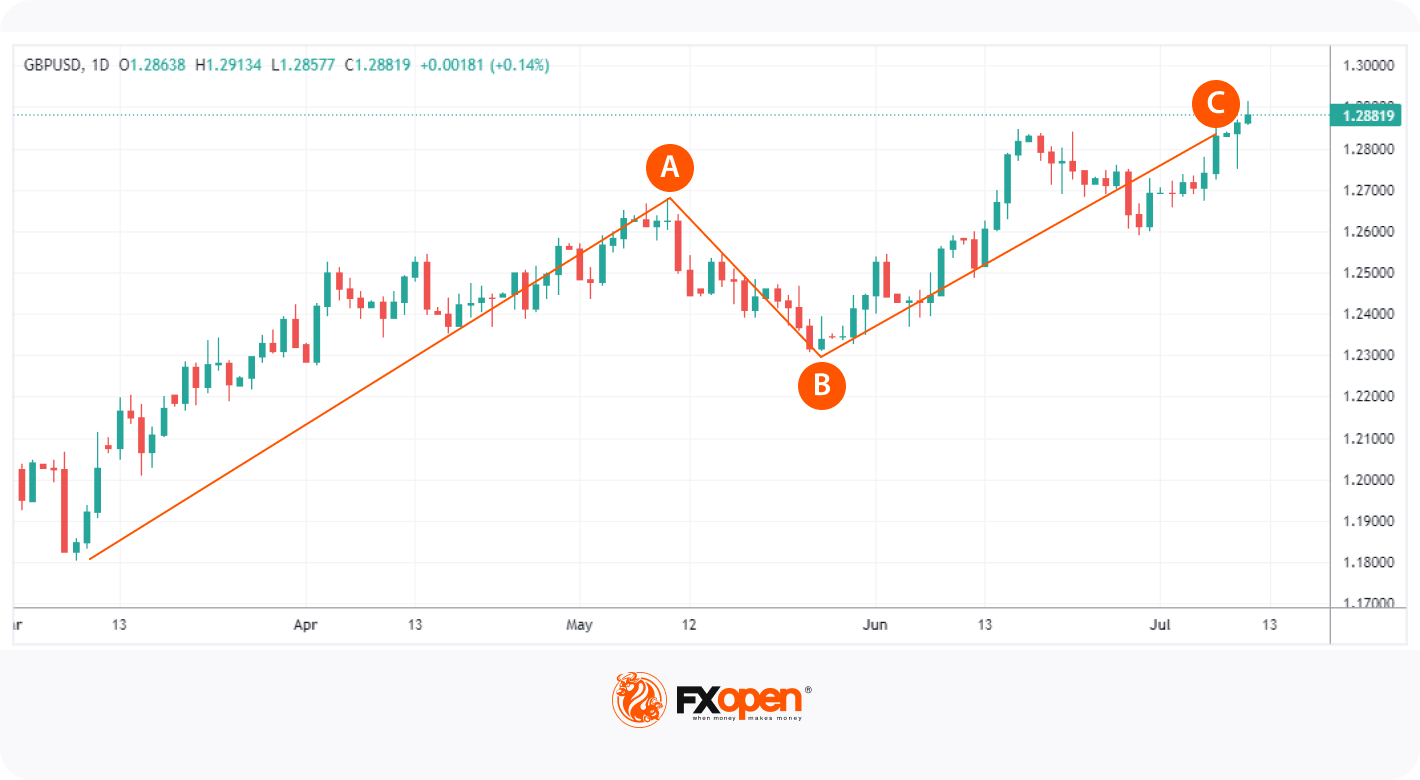
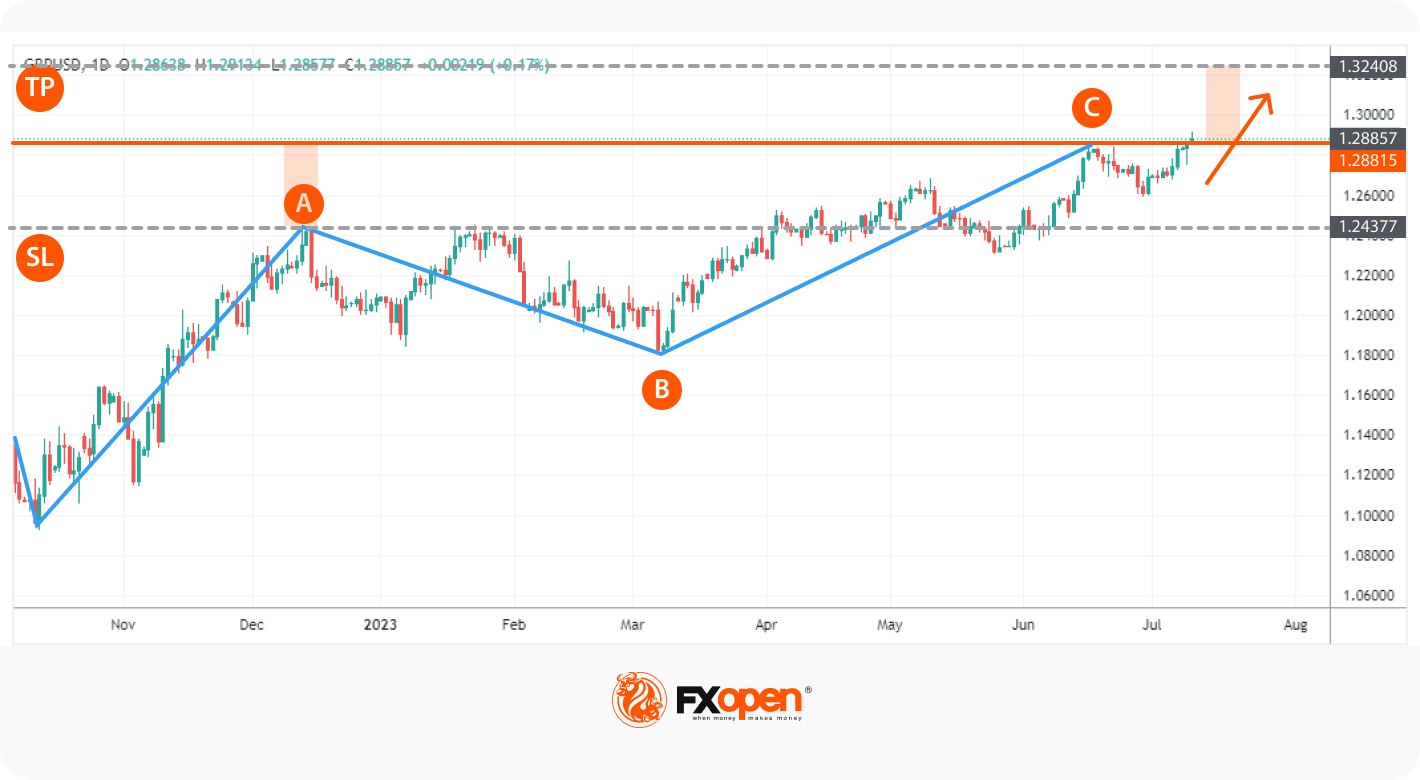
An example of a bullish formation on a GBP/USD daily chart.
The Main Rules for Zigzag Patterns
The Elliott wave zigzag rules are essential for understanding and identifying this formation in market trends. The main rule is the '5-3-5' sequence.
The first wave, 'A', is made up of five smaller ones, followed by wave 'B' consisting of three smaller ones, and finally, wave 'C' with five smaller waves. It's important to note that waves 'A' and 'C' tend to be equal, and 'B' doesn't travel into the price territory of the start of wave 'A.’
Another important rule is that in a zigzag, 'B' is always shorter than 'A,’ and 'C' is often as long as 'A'. Sometimes, however, the 'C' wave can be longer than the 'A' wave.
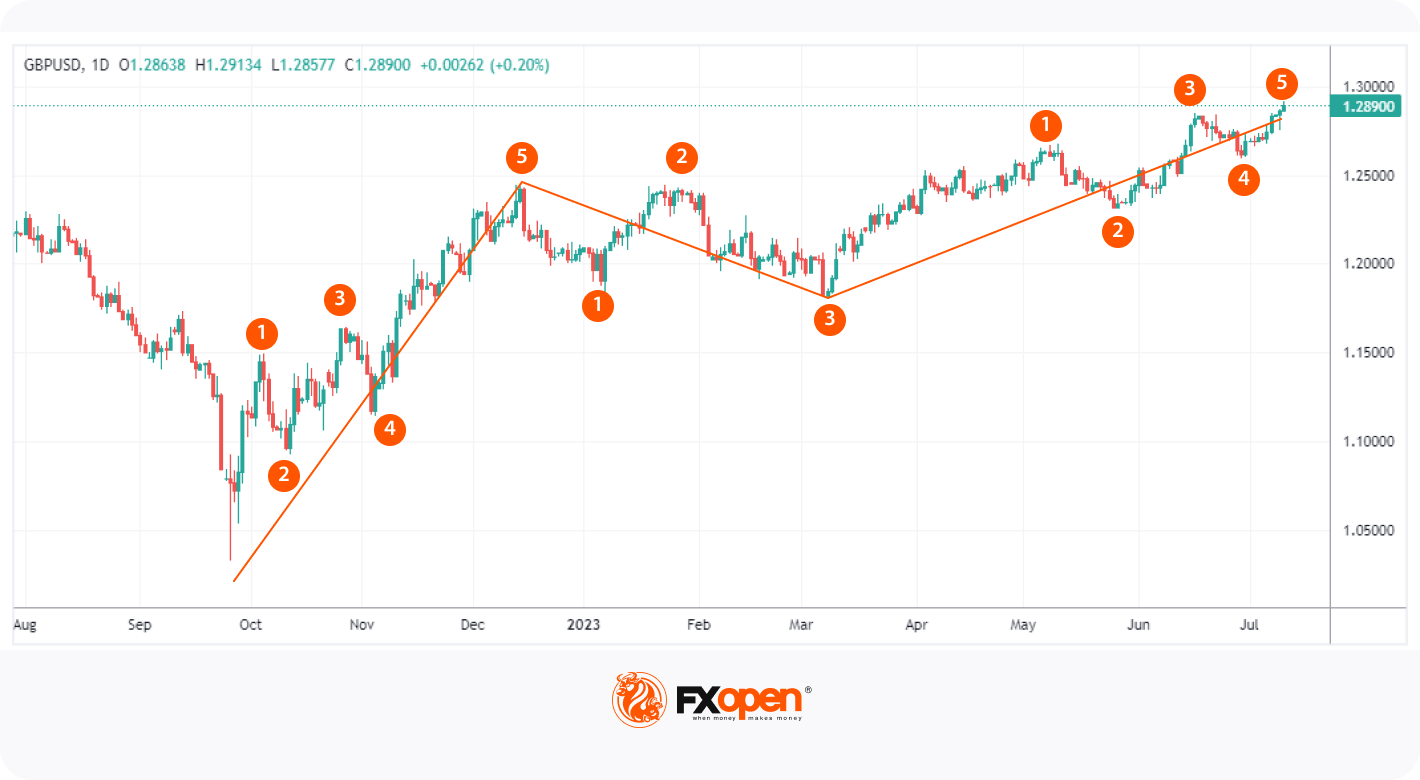
5-3-5 sequence
Below, you will find a set of rules that are very important when analysing charts using the wave theory:
- A is usually an impulse wave. Impulse waves are made up of five smaller ones and move in the same direction as the bigger trend they are part of.
- C is usually an impulse wave too.
- C often mirrors A in length.
- C almost invariably concludes past the endpoint of A.
- B normally retraces between 38 and 79 per cent of A.
- Should B transform into a triangle, it typically retraces between 38 to 50 per cent of A. A triangle includes 5 waves (ABCDE), which contract as the pattern develops.
- Should B take the form of a running triangle, it typically retraces between 10 and 40 per cent of A. The running triangle is a unique formation where wave B of the triangle reaches a new price peak beyond the triangle's start, resulting in a 3-wave sequence. It can mislead some traders into thinking a new impulse has formed.
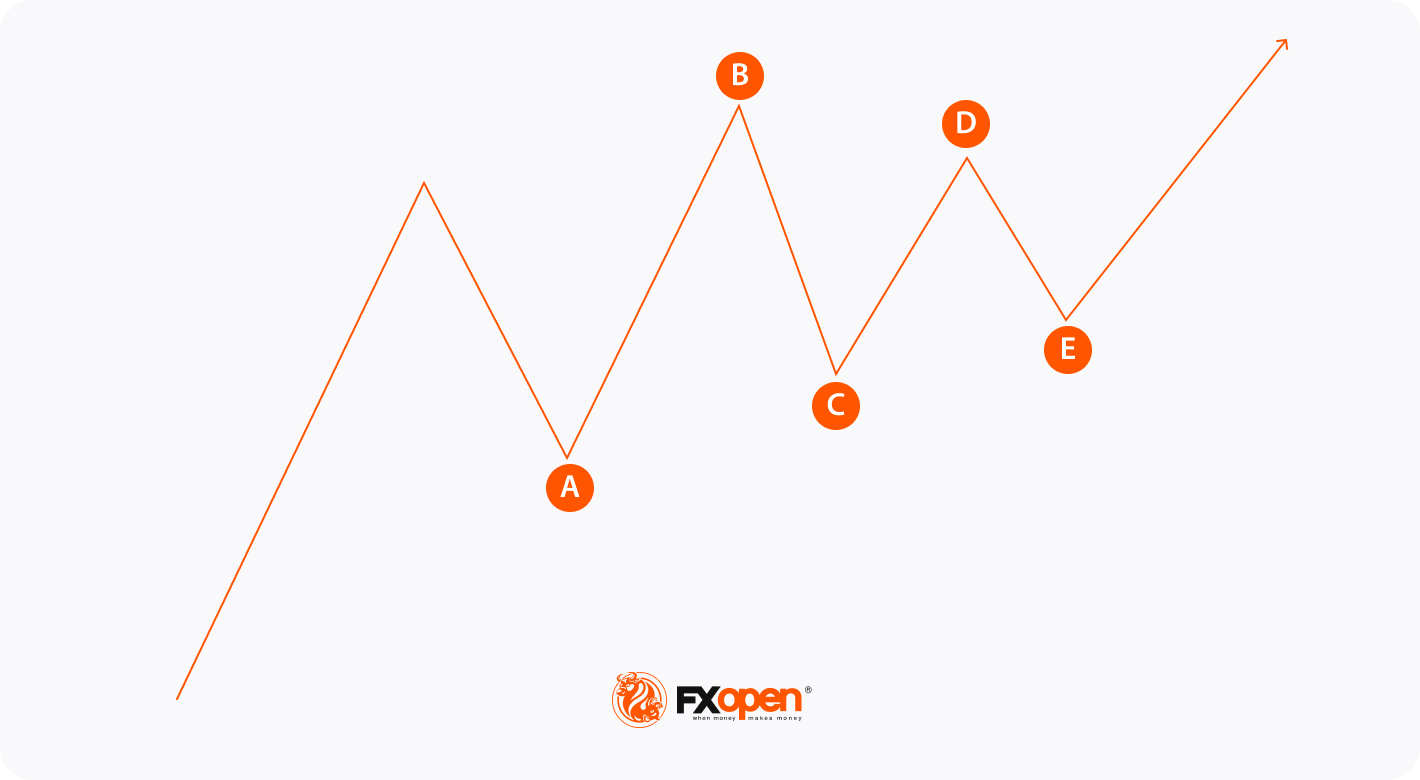
An example of a running triangle
- Should B assume a zigzag form, it usually retraces between 50 and 79 per cent of A.
The Zigzag Indicator
To identify the zigzag Elliott wave pattern, you can use an indicator. It identifies significant changes in price, ignoring smaller, less significant fluctuations. Fortunately, you don’t need to learn the zigzag indicator formula, as it’s implemented automatically on the TickTrader platform.
The zigzag uses a percentage parameter to identify these significant price changes, typically a change of at least 5%. If the price changes by less than this percentage, the indicator assumes that the price move is just a normal market 'noise' and not a meaningful trend change.

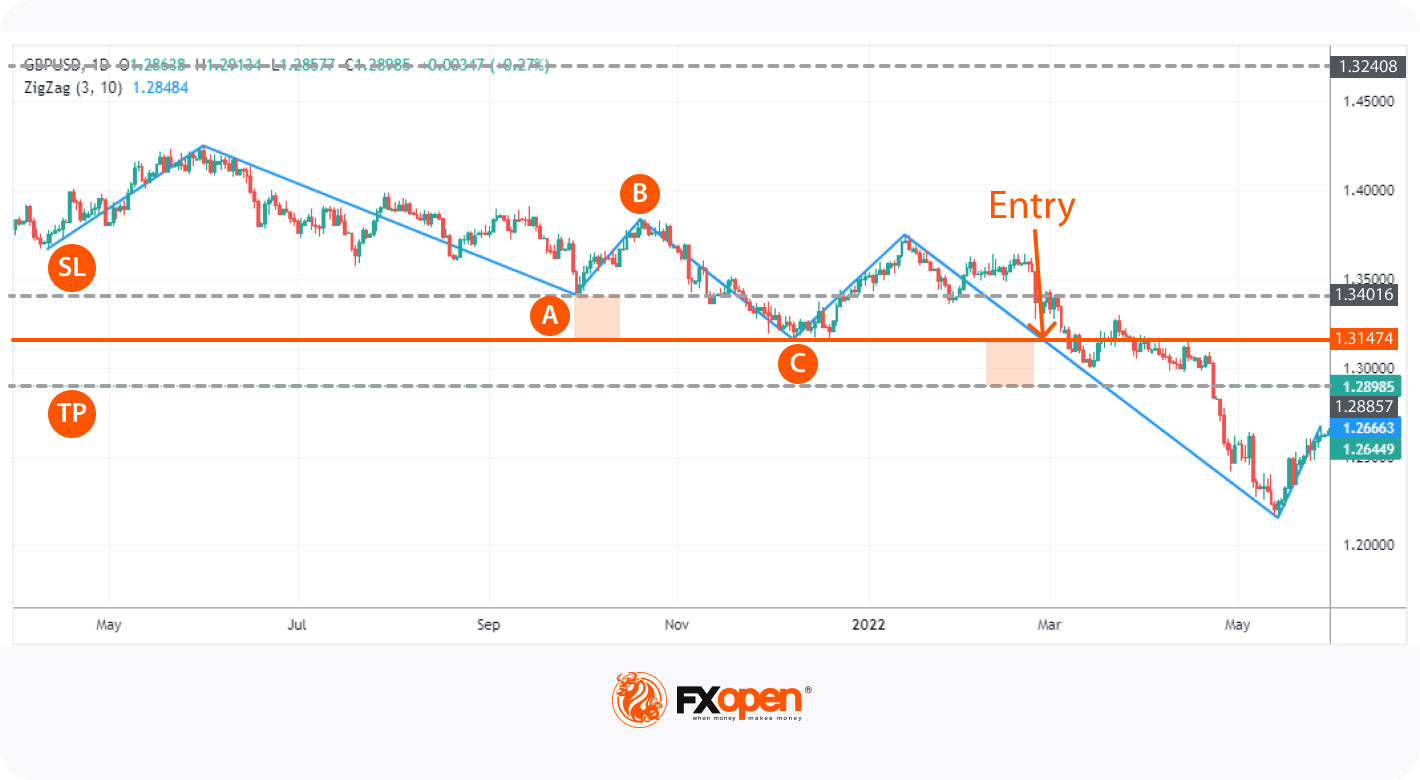
The indicator used on the GBP/USD daily chart.
How to Use a ZigZag Indicator in Trading
To utilise the zigzag in daily trading across various asset classes, you can implement a simple trend-following strategy. This involves observing the high or the low determined by the end of wave C and executing a transaction when it is breached. You can open an FXOpen account and try trading using the indicator.
Long position (buy):
After drawing wave C and having it establish a local high, traders draw a horizontal resistance at this point. When the price breaks above the resistance, they open a long position. Alternatively, at this point, they can set a limit order so that the position opens automatically when the indicated level is breached.
The stop-loss (SL) order can coincide with the peak of wave A, whereas the take-profit (TP) order can replicate the distance from wave A's high to wave C's high.
Short position (sell):
After drawing wave C and having it establish a local low, traders draw horizontal support at this point. When the price breaks below the support, they open a short position. Alternatively, at this point, they can set a limit order so the position opens automatically.
The stop-loss (SL) order can coincide with the minimum of wave A, whereas the take-profit (TP) order can replicate the distance from wave A's low to wave C's low.
Zigzag Indicator Limitations
While the zigzag indicator is useful in identifying the formation, it has its limitations. One key limitation is that it is purely a retrospective tool, meaning it can only identify setups after they have occurred. This makes the zigzag indicator less useful for predicting future price movements.
Additionally, the indicator may not always accurately identify significant price changes, especially in volatile markets. Therefore, it is crucial for traders to understand the limitations of the zigzag indicator and not rely on it as their sole trading tool.
Conclusion
Understanding the Elliott wave zigzag rules can provide valuable insights for traders looking to predict market trends. While the indicator has its limitations, it remains a useful tool for market analysis when used correctly and in conjunction with other trading strategies and instruments.
To learn more about trading, visit the FXOpen website. Remember, always perform your due diligence before making any trading decisions. Trading involves risk and is not suitable for everyone.
This article represents the opinion of the Companies operating under the FXOpen brand only. It is not to be construed as an offer, solicitation, or recommendation with respect to products and services provided by the Companies operating under the FXOpen brand, nor is it to be considered financial advice.
Stay ahead of the market!
Subscribe now to our mailing list and receive the latest market news and insights delivered directly to your inbox.


Latest articles

GBP/CHF: Trendline or RSI — Which One Is Lying?
Sterling enters this week on firmer footing, with political uncertainty fading fast after Andy Burnham's confirmation as Labour leader eased investor concerns over the succession to Keir Starmer. Markets reacted further to reports pointing to Shabana Mahmood as the frontrunner

Silver Attempts to Break Out of Its Range
Silver continues to balance between its dual role as an industrial metal and so-called refuge asset, and this combination largely explains the lack of a clear trend in recent weeks. Shifting expectations for central bank interest rates can influence the

Nasdaq 100: Is This the Correction Traders Have Been Waiting For?
The Nasdaq 100 (US Tech 100 Mini on FXOpen) remains caught between two opposing forces: cooling inflation on one side, and persistent geopolitical instability on the other. On 14 July, June's CPI print came in softer than expected, easing near-term