


FXOpen

The start of October brings plenty of macro data for traders to analyse as high inflation and low growth continue to weigh heavily on central bankers' and politicians' minds.
ISM Manufacturing PMI (17:00 GMT+3) from the States gets the ball rolling on Monday. It has been below 50 (signalling a contraction) for almost a year now, but the last couple of months have been better than expected. 47.7 is the analysts' estimate for this month, so anything above this could be bullish for the US dollar.
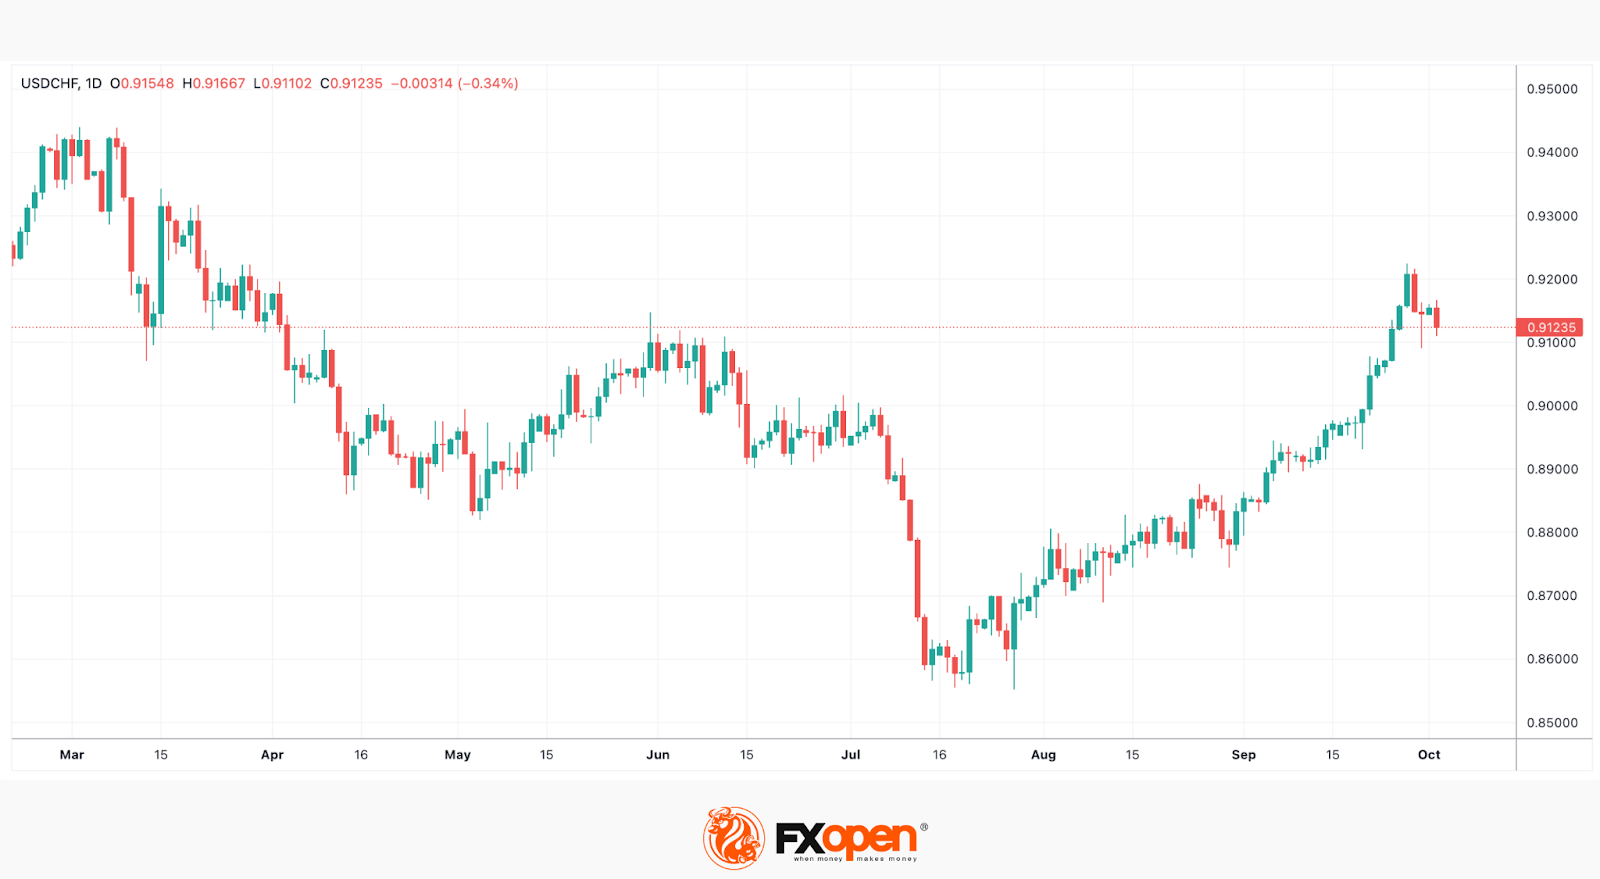
The Reserve Bank of Australia (Tuesday 06:30 GMT+3) has kept interest rates at 4.1% since June, and with inflation ticking down to 5.9%, analysts are not expecting a rise this month. However, the RBA does have a habit of surprising the market and has not ruled out further increases.

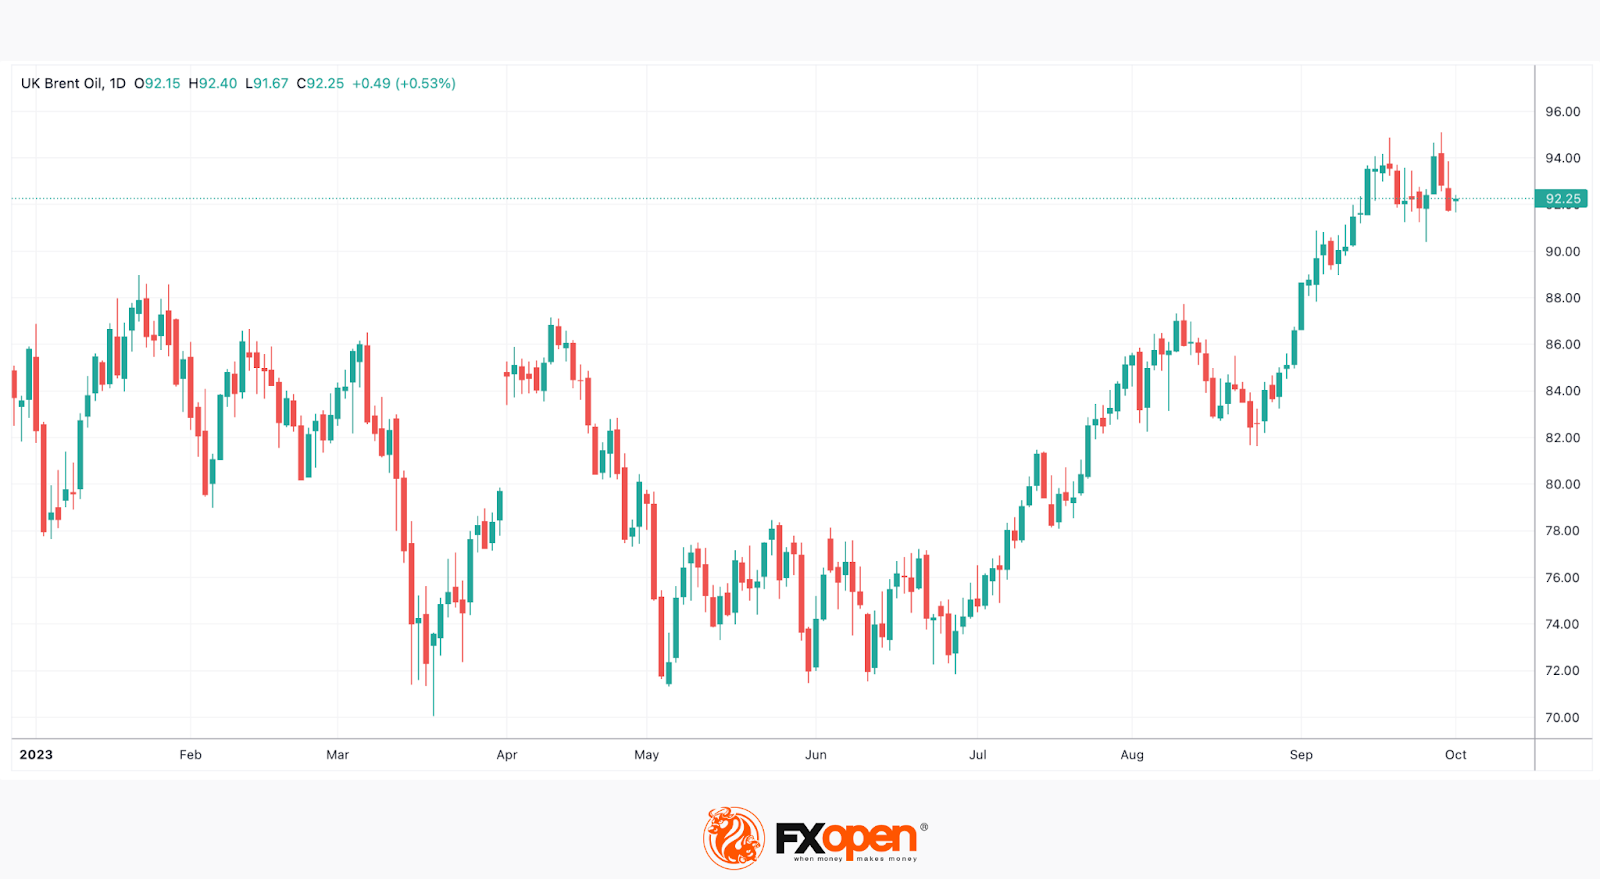
The volatility in the oil market shows no sign of abating, with Brent hitting a 2023 high of $95 last week. OPEC+ has a meeting on Wednesday where the cartel is expected to continue with its current output levels, which have ramped up prices by 30% since June.
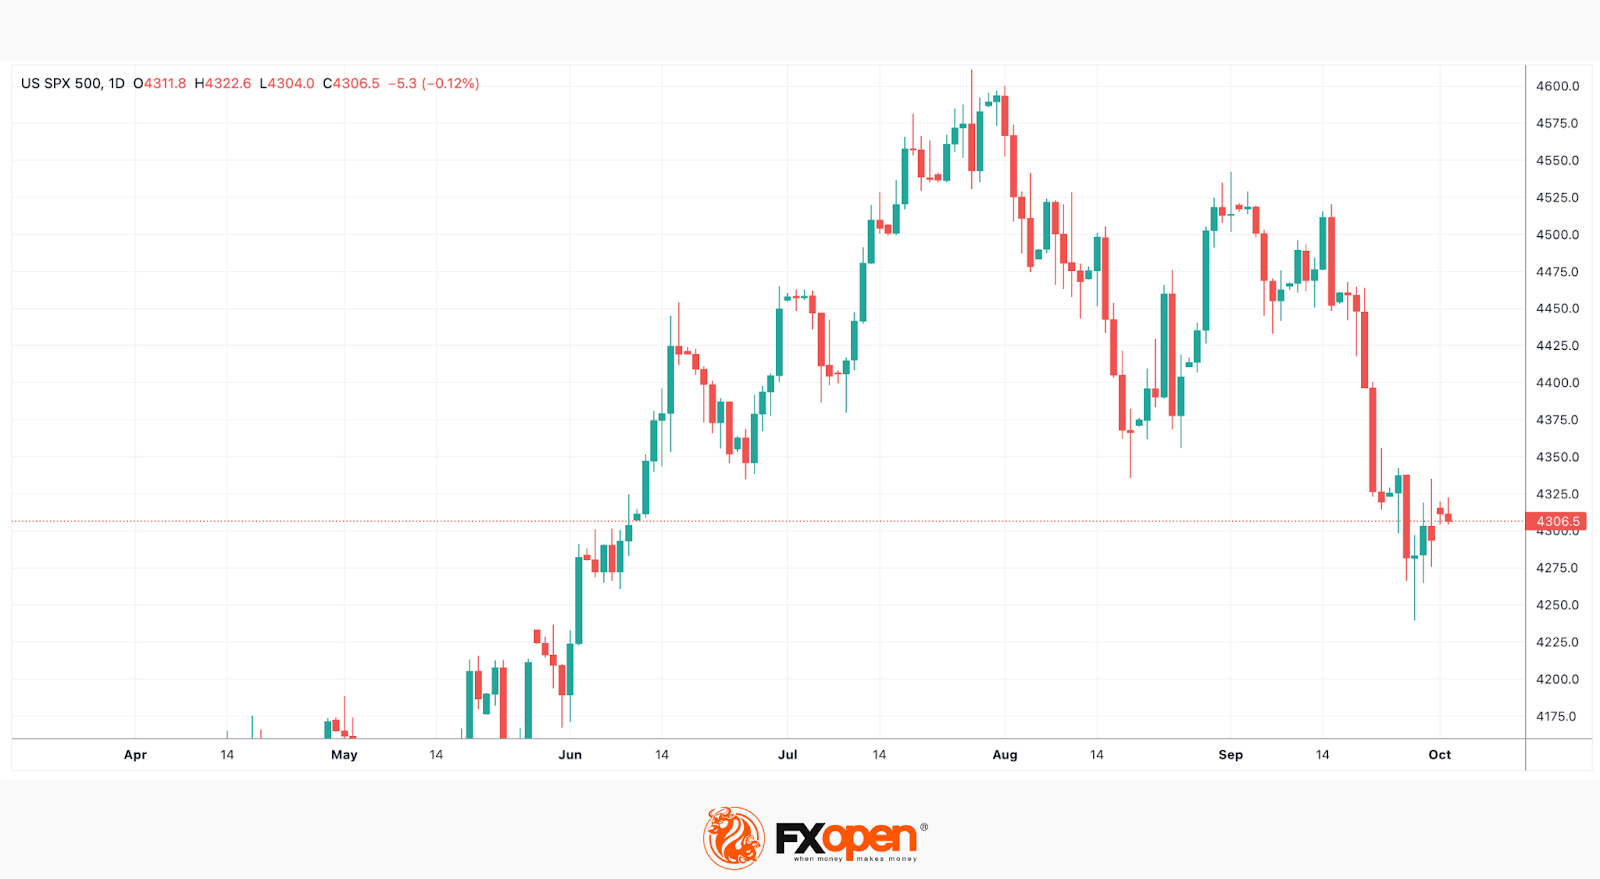
Non-farm Payrolls and Unemployment data are released at 15:30 GMT+3 on Friday, where 160K and 3.7% are the analysts' expectations. However, with the Fed on hold, a strong number could well induce another rate hike later in the year, which would add more pressure to the equity markets, which have been in decline for the last two months.
This article represents the opinion of the Companies operating under the FXOpen brand only. It is not to be construed as an offer, solicitation, or recommendation with respect to products and services provided by the Companies operating under the FXOpen brand, nor is it to be considered financial advice.
Stay ahead of the market!
Subscribe now to our mailing list and receive the latest market news and insights delivered directly to your inbox.


Latest articles

USD/CAD Rises to a Two-Month High
Today, the USD/CAD currency pair climbed above the 1.3787 level for the first time since late January.
→ Demand for the US dollar is being supported by concerns over escalating tensions in the Middle East. Market participants are favouring

Alphabet (GOOGL) Shares Fall to 2026 Low
As the chart shows, Alphabet (GOOGL) shares have dropped to their lowest level of 2026, with trading closing well below the psychological $300 per share mark.
Why Have Alphabet (GOOGL) Shares Declined?
The bearish move is driven by a combination

FX Market Awaits Macro Data: EUR/USD and GBP/USD Near Range Boundaries
European currencies are trading without a clear direction against the US dollar, remaining in a consolidation phase following the earlier decline driven by USD strength. At the start of the week, both EUR/USD and GBP/USD attempted a recovery,