


Economic Calendar: US PCE Price Index and GDP Growth Will Determine Market Dynamics
FXOpen

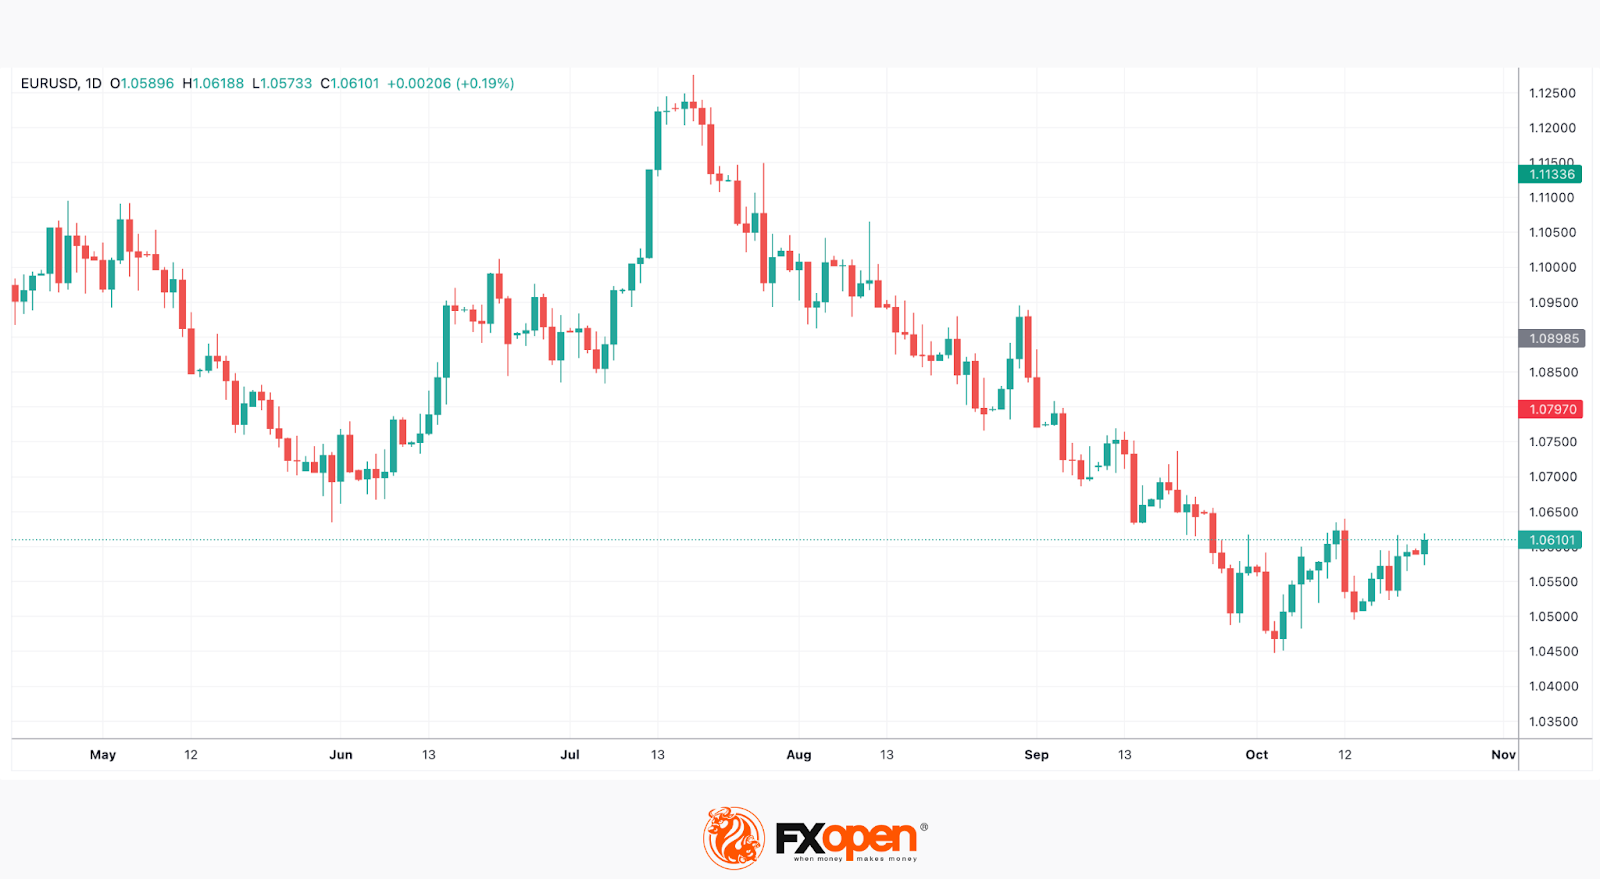
On Friday (15:30 GMT+3), markets will pay attention to the Personal Consumption Expenditure (PCE) Price Index, the metric the Federal Reserve prefers to gauge the inflation level. According to forecasts, the annual Core PCE declined to 3.7% in September, compared to 3.9% the month before. Still, the Fed targets an average inflation rate of 2%. Analysts expect that the Core PCE MoM level rose 0.3% in September, up from 0.1% in August. The Fed is in its blackout period this week, ahead of the meeting scheduled for October 31-November 1. According to the CME FedWatch Tool, there is a 98.5% chance the central bank will keep the interest rate on hold at the current 525-550 bps level. A significant deviation from the forecast may lead to increased volatility in US markets.
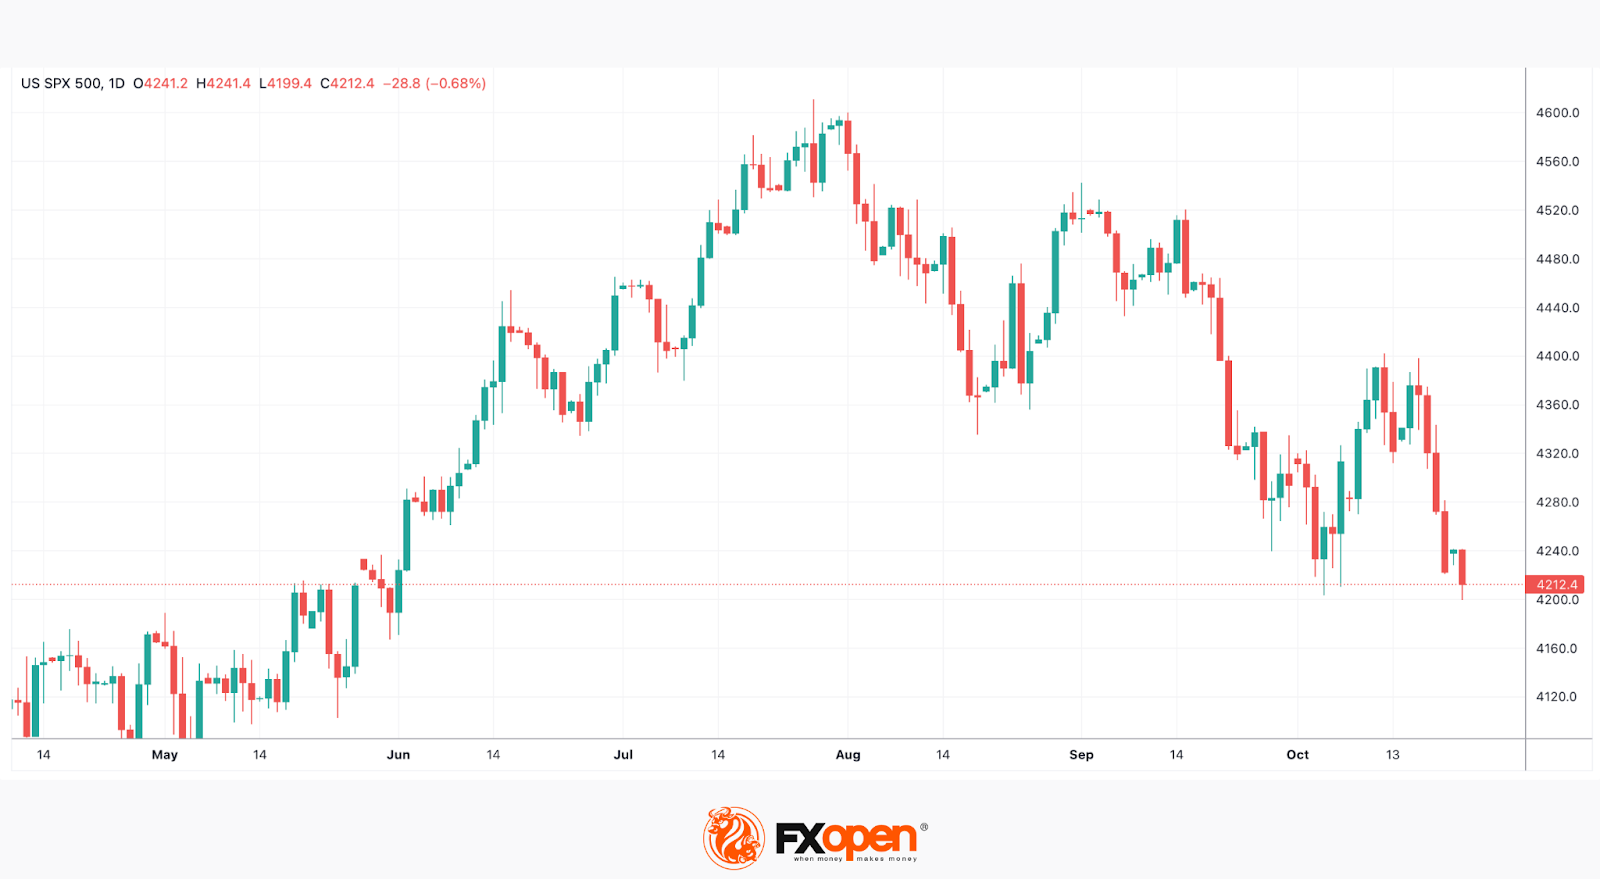
This week, traders will closely monitor earnings reports from four of the so-called "Magnificent Seven'' stocks that include Microsoft, Amazon, Alphabet, and Meta. These stocks pushed the S&P 500 index higher this year. Alphabet and Microsoft will report on Tuesday, Meta will announce its quarterly results on Wednesday, and Amazon will present its results on Thursday. Better-than-expected data may boost the leading US stock indices.
US GDP growth will be tracked by traders on Thursday (15:30 GMT+3). According to the forecasts, the GDP growth rate in the third quarter increased to 4.2%, up from 2.1% in the second quarter, due to stronger-than-expected gains in exports, consumer spending, and employment. Enormous growth may lead to the appreciation of the US dollar.
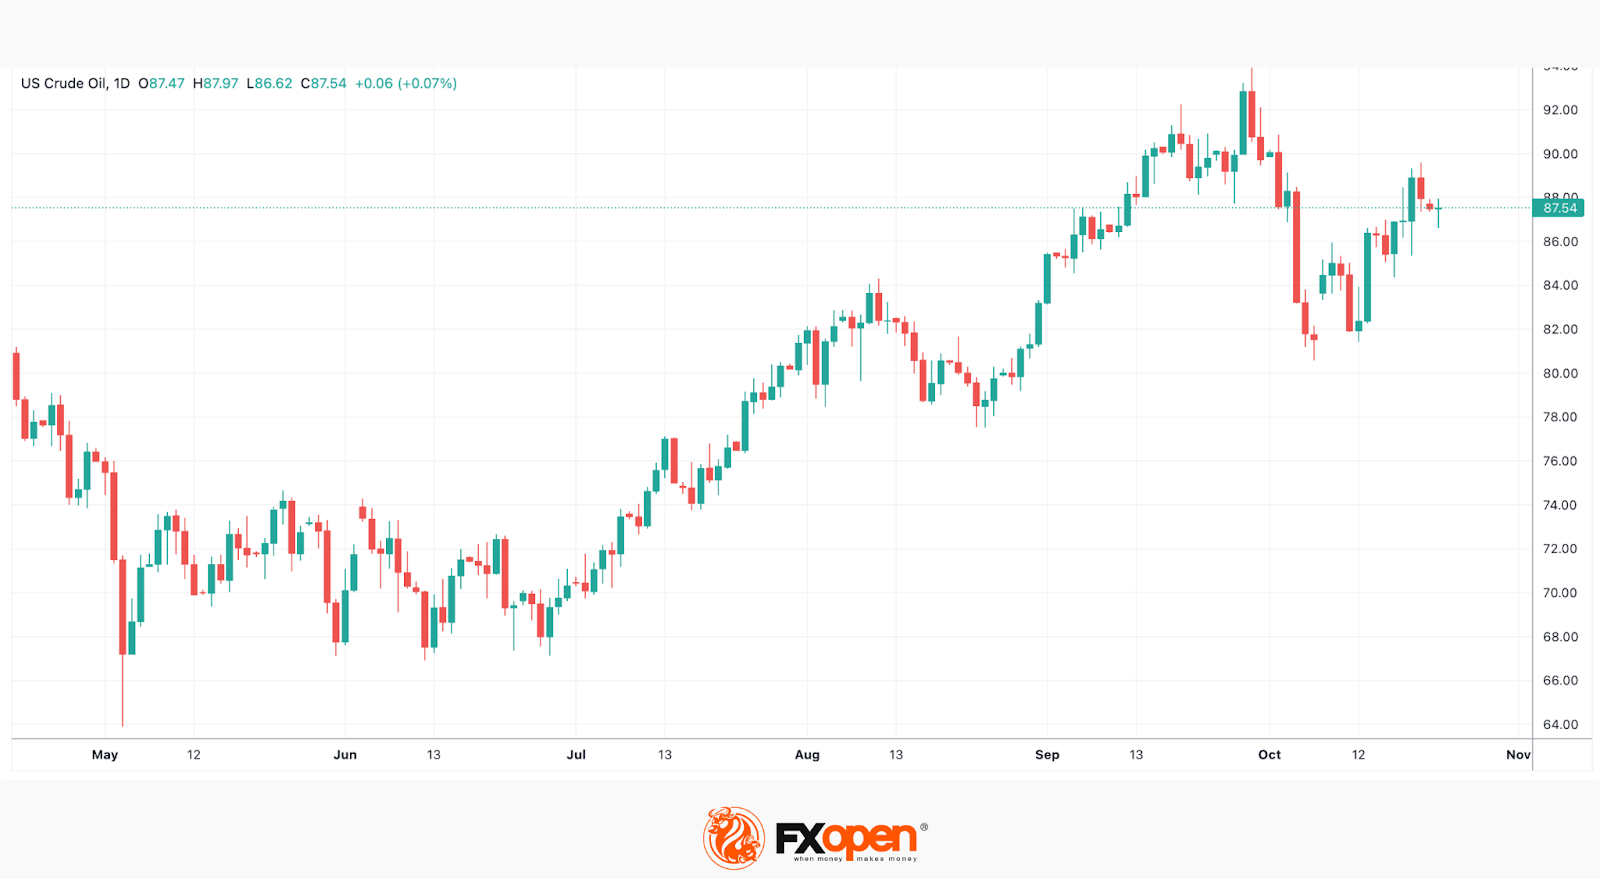
The economic calendar doesn’t list crucial events for the oil market. On Wednesday, markets may check the weekly EIA Crude Oil Inventories report (17:30 GMT+3). However, the main focus will be on developments in the Middle East. Geopolitical tensions keep creating enormous volatility, including in the oil market.
This article represents the opinion of the Companies operating under the FXOpen brand only. It is not to be construed as an offer, solicitation, or recommendation with respect to products and services provided by the Companies operating under the FXOpen brand, nor is it to be considered financial advice.
Stay ahead of the market!
Subscribe now to our mailing list and receive the latest market news and insights delivered directly to your inbox.


Latest articles

US Dollar Strengthens Amid Equity Market Weakness and Hawkish Fed Rhetoric
The US dollar continues to hold firm near multi-year highs as sentiment across equity markets deteriorates and investors increasingly expect the Federal Reserve to maintain a restrictive monetary policy stance for longer. The US economy remains resilient, while inflation risks

Bitcoin: Corrective Channel Broken as Traders Turn More Active
Bitcoin has come under the influence of several factors simultaneously. The wave of selling at the beginning of June was linked to Strategy's first disclosed Bitcoin sale in several years, a prolonged series of outflows from spot ETFs, and a

DAX 40: consolidation amid technology sell-off
A wave of selling in the technology sector that emerged earlier this week has weighed on European equities. The trigger was investor concern over the profitability of large-scale debt-funded investments by major US tech companies in AI infrastructure. The Nasdaq