


Economic Calendar: US PMI Data, Stock Market Decline, and Oil Surge
FXOpen

After falling for the majority of August, stocks managed to rally in the last week of the month. The Nasdaq Composite surged by over 3%, the S&P 500 increased by 2.5%, and the DJI rose by 1.4%. History says September is primarily the worst period for the American stock market – the S&P 500 and Nasdaq usually go down this month. However, some analysts believe that a downward shift in consensus views on inflation and its risks may change the market sentiment to positive.
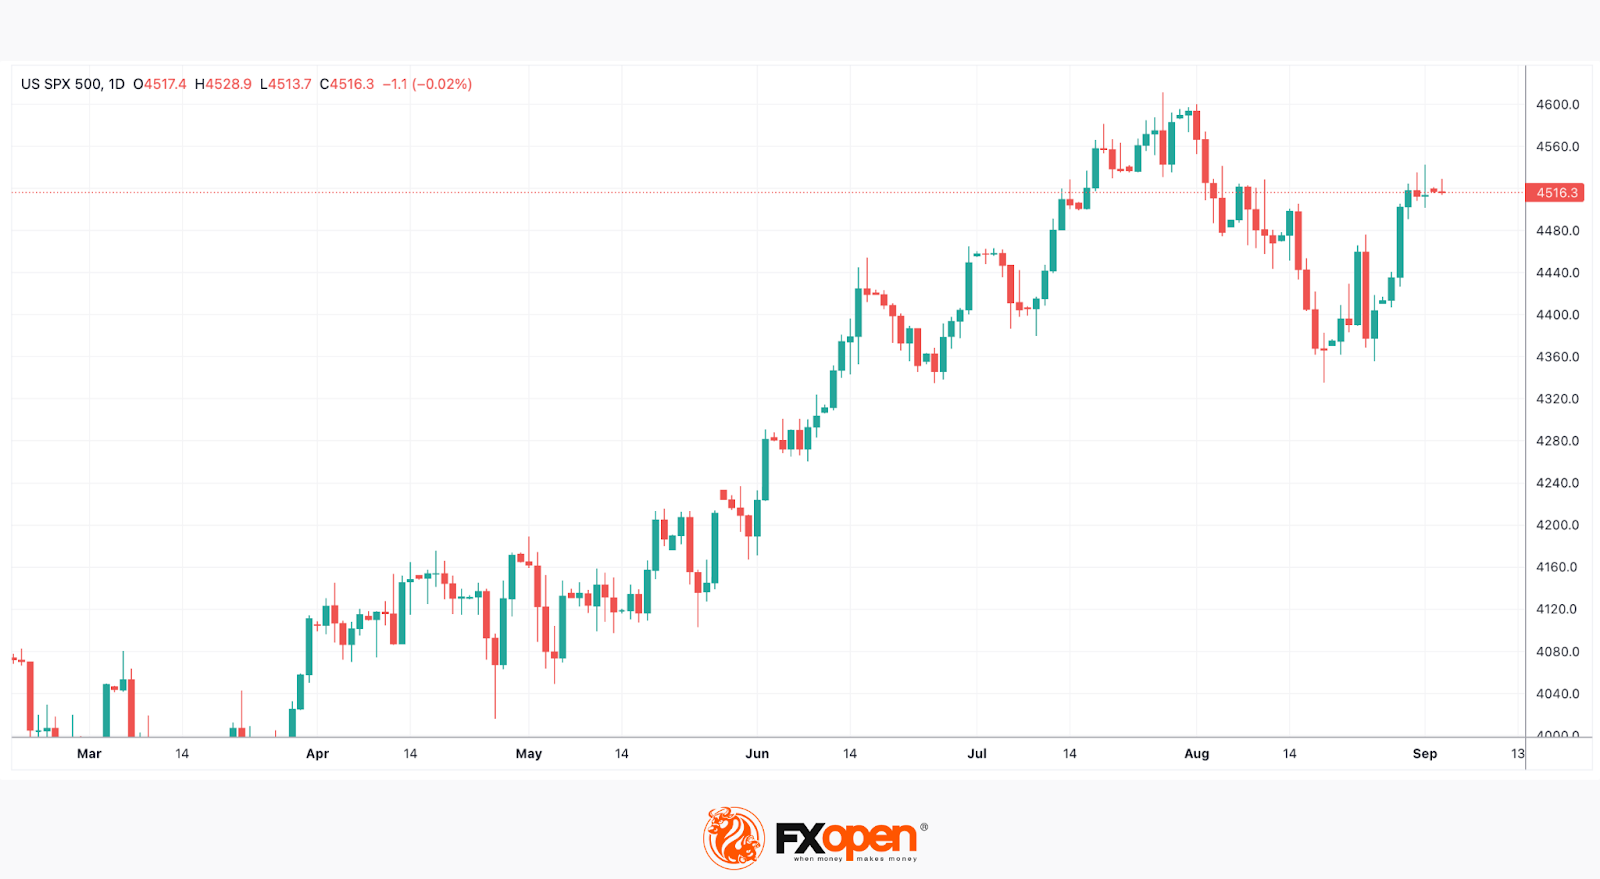
On Wednesday, traders will track the S&P Global Services and Composite PMI (16:45 GMT+3) and ISM Services PMI (17:00 GMT+3) releases, while on Thursday, markets will pay attention to Initial Jobless Claims (15:30 GMT+3). Also, on the same two days, there will be a vast number of speeches made by Fed FOMC speakers, which will provide clues on the central bank’s interest rate outlook. Although there is an over 90% chance the central bank will keep the rate on hold in September, these events may add volatility to the US markets.
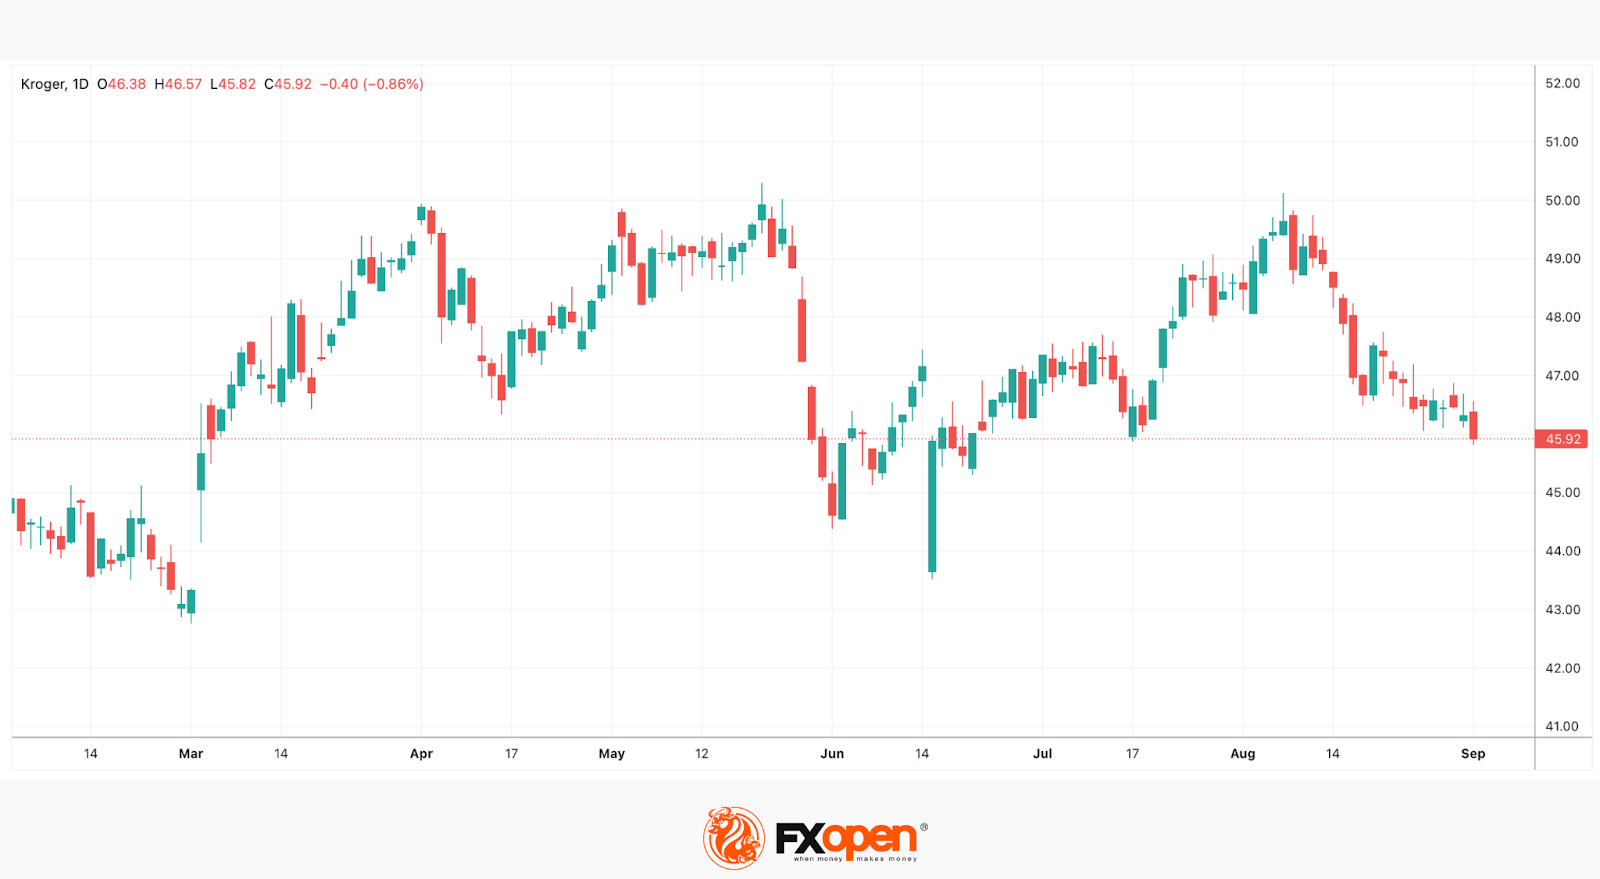
Ahead of the opening bell on Friday, Kroger, one of the biggest supermarket chains in the US with a market cap of $33 billion, will report its second-quarter financial results. Analysts are quite pessimistic due to a decline in footfall at its grocery stores. According to forecasts, the company’s revenue may fall 1.5% annually to $34.12 billion. Traders should be cautious as the data may be priced in.
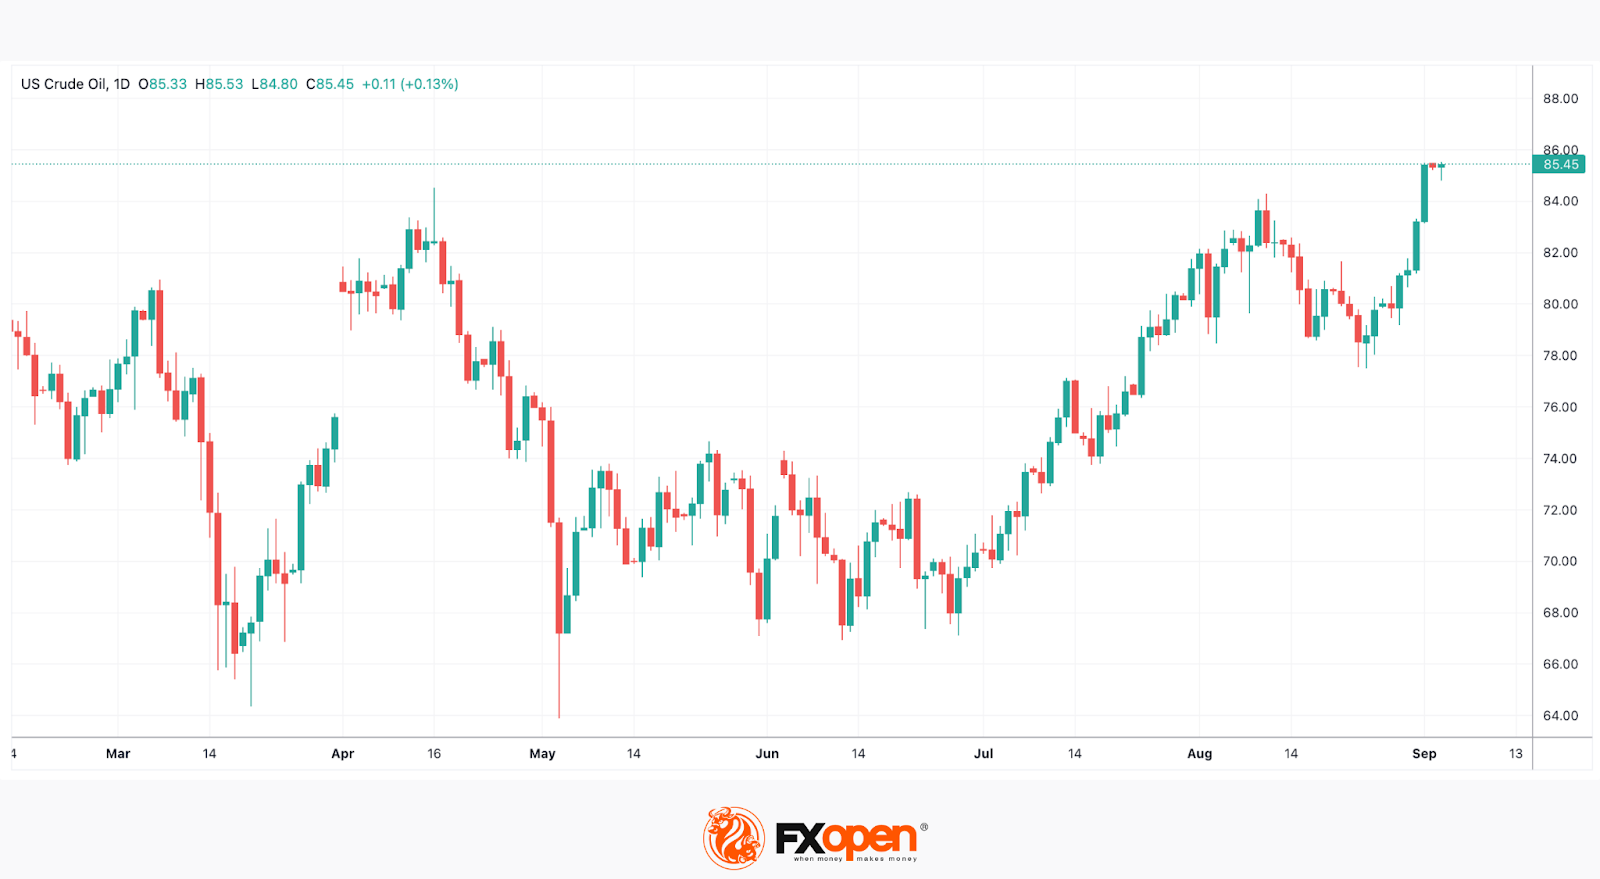
At the end of the last week, oil prices skyrocketed to levels last seen more than seven months ago. The major drivers were concerns over tightening supply. In terms of weekly data, Brent Crude Oil increased by about 5%, the largest weekly growth since late July, while WTI Crude Oil gained around 7%, the most significant increase in a week since March. The significant surge may make the markets highly volatile.
This article represents the opinion of the Companies operating under the FXOpen brand only. It is not to be construed as an offer, solicitation, or recommendation with respect to products and services provided by the Companies operating under the FXOpen brand, nor is it to be considered financial advice.
Stay ahead of the market!
Subscribe now to our mailing list and receive the latest market news and insights delivered directly to your inbox.


Latest articles

AI Valuations Are Back in the Spotlight
Artificial intelligence remains the dominant investment theme of 2026, but investors are increasingly questioning whether AI stock valuations are keeping pace with reality.
💰 Big Tech continues to invest at an unprecedented scale, with hyperscaler AI spending projected to exceed $800

AUD/CAD: Months of Indecision — Is a Breakout Finally Coming?
The Australian dollar has clawed back most of its end-of-June losses, when it touched three-month lows against the greenback amid escalating Middle East tensions. Since then, sentiment has improved: the RBA's Assistant Governor Sarah Hunter signalled the board stands ready

USD/JPY: Battling at the Top of the Triangle
On 3 July, Japan's Finance Minister, Satsuki Katayama, stated that the Ministry of Finance remains in close contact with US authorities regarding developments in USD/JPY as the yen traded near its weakest level in almost 40 years. Similar verbal