


Trading with Engulfing Patterns: Structure and Techniques
FXOpen
Engulfing patterns are among the most recognisable candlestick formations in trading, often signalling a potential shift in market momentum. Whether you trade forex, stocks, or commodities, these patterns can offer valuable clues about changing sentiment between buyers and sellers. This FXOpen article explains what engulfing patterns are, how they form, and how traders may use them to identify potential reversals and build their trading strategies.
What Is an Engulfing Pattern?
The engulfing pattern is a two-candle reversal formation. It emerges when a candle on the price chart wholly "engulfs" its preceding candle. The first candle's small body suggests a weakening trend, while the larger second candle indicates a market sentiment shift. Whether it's bullish or bearish depends on its position relative to the current market trend.
Bullish Engulfing Pattern
The bullish engulfing pattern features a small bearish candle that reflects the current downtrend, followed by a larger bullish candle that completely engulfs the previous body, signalling a sharp shift in momentum.
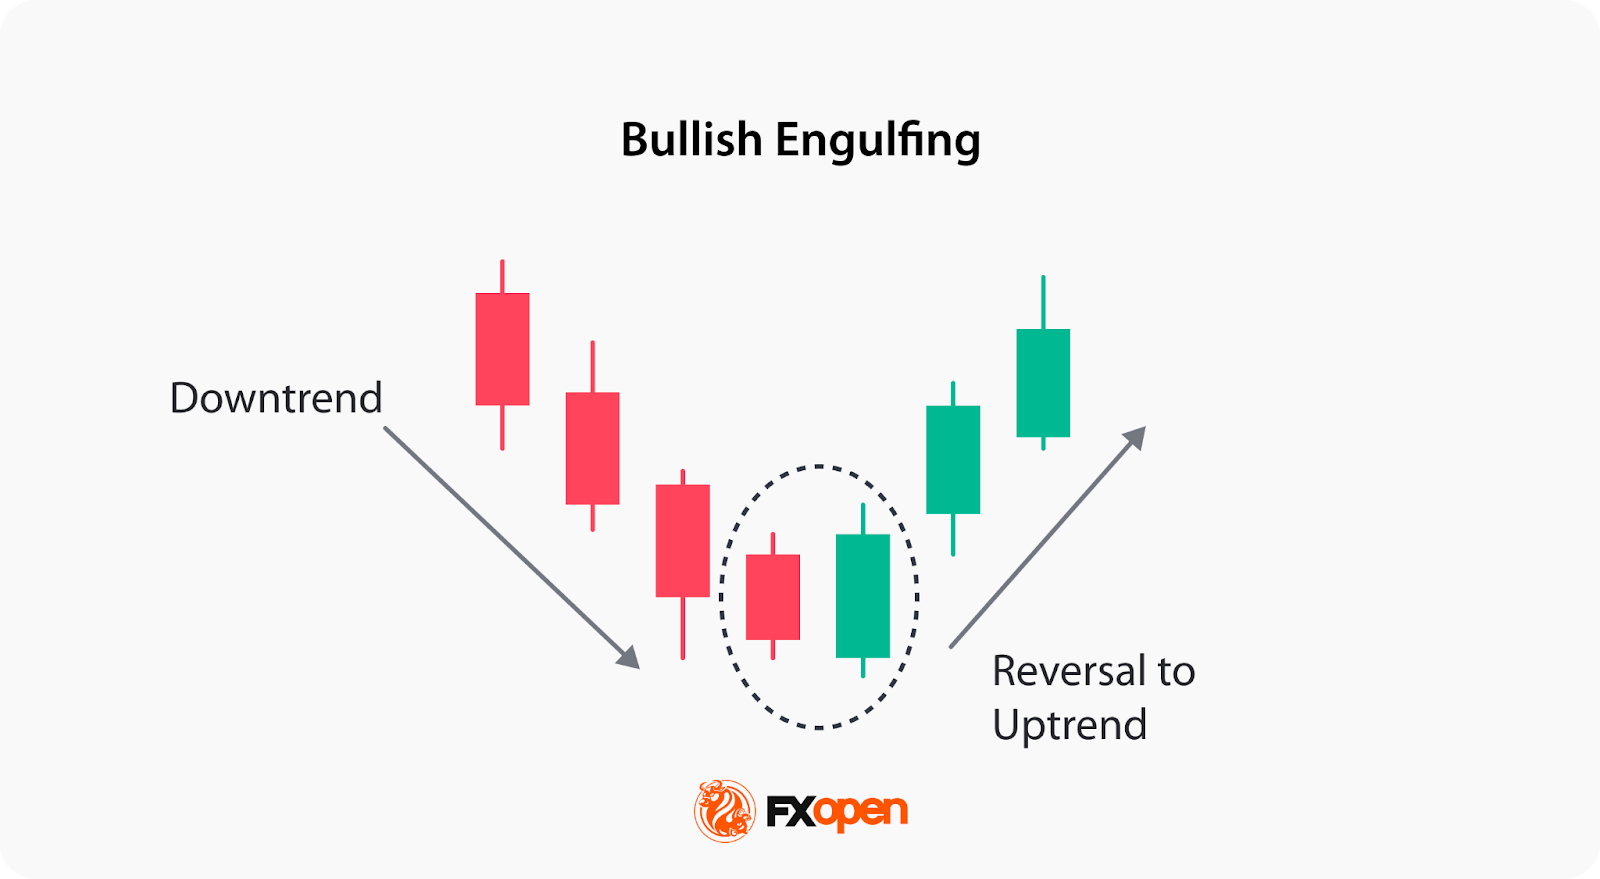
For the pattern to be valid, it must appear during a clear downtrend. The large bullish engulfing candle that covers its predecessor suggests strong buying pressure. This initial surge in demand may pave the way for a potential upward move in the market.
Bearish Engulfing Pattern
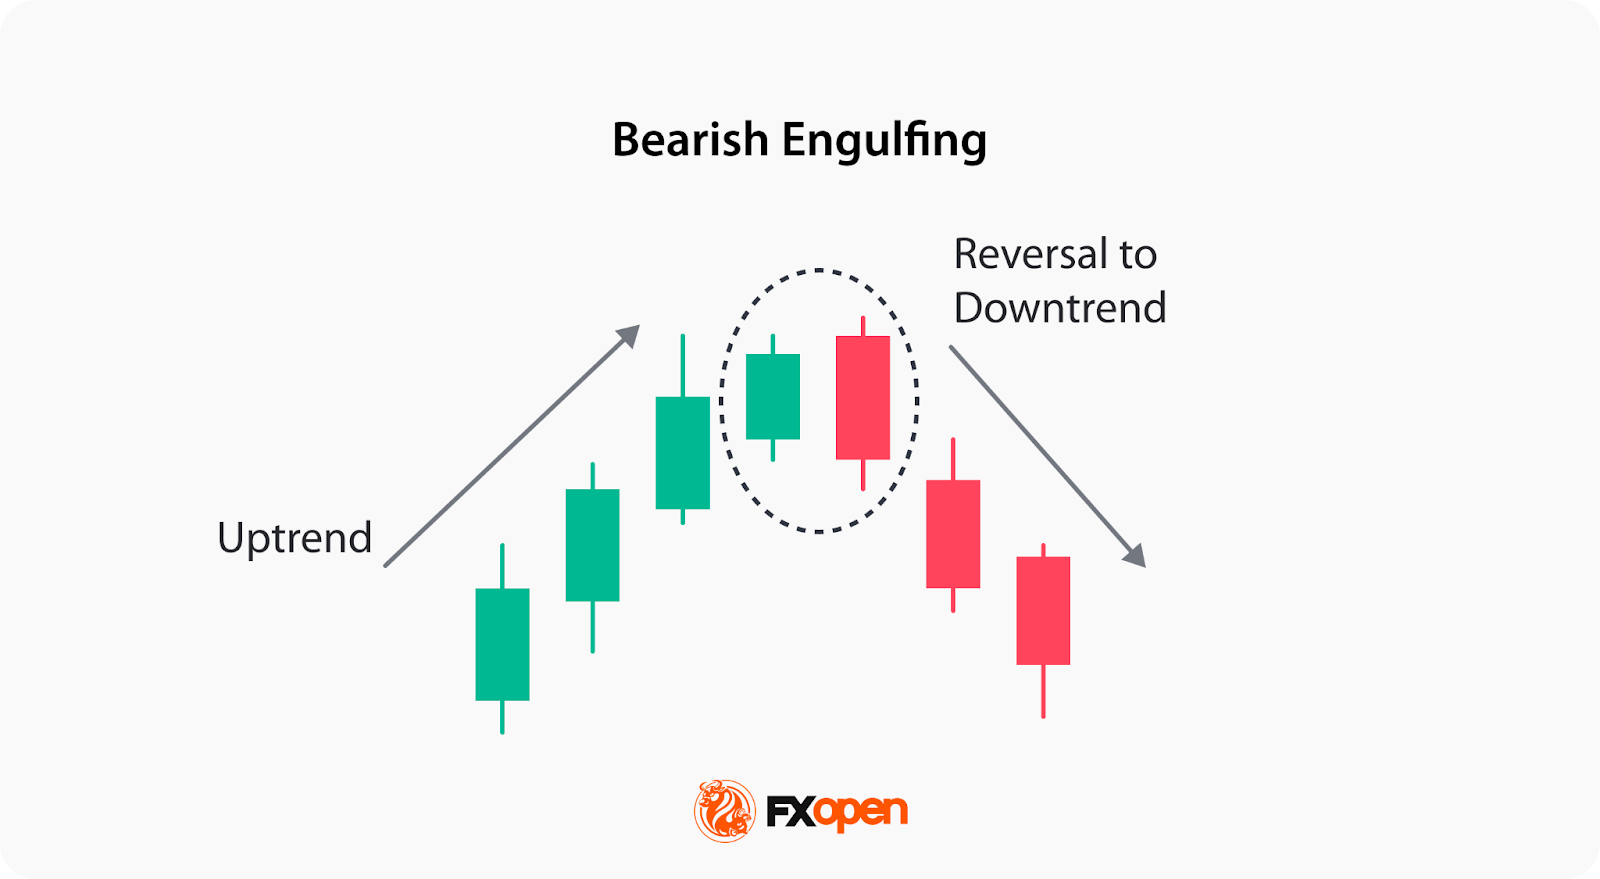
While the bullish formation signals a potential price increase, the bearish engulfing is a sign of a possible downturn. This pattern is mostly used when it emerges at the peak of an uptrend, indicating a surge in selling pressure and suggesting a shift in market sentiment.
It involves two candles — the first bullish candle represents the ongoing uptrend, where buyers have been in control, and prices have been rising. However, the second bearish candle completely covers the previous one. This dramatic change in candle size symbolises a sudden influx of sellers eager to drive prices down.
How May Traders Spot and Use Engulfing Patterns On a Chart?
Engulfing candlestick patterns appear at important turning points in the market, signalling where buyers or sellers are beginning to take control. Spotting and applying these setups starts with recognising context—the broader trend matters as much as the pattern itself.
Step 1: Identifying the Trend
Before looking for engulfing setups, traders determine whether the market is trending up or down. A bullish engulfing setup gains significance only when it appears after a clear downtrend, while a bearish engulfing carries more weight at the end of an uptrend. Without this context, the pattern can be misleading.
Step 2: Spotting the Formation
Then, traders look for two consecutive candles. The first is smaller and reflects fading momentum in the prevailing trend. The second candle should completely engulf the first candle’s body, showing a strong shift in market sentiment.
Step 3: Confirming with Additional Signals
Traders often check for confirmation using technical indicators or market structure cues. This includes support and resistance zones, trendline breaks, or tools like the Stochastic Oscillator and Volumes. For instance, if a bullish engulfing forms near a strong support level while the Stochastic forms divergence with the price, that may strengthen the case for a reversal.
Step 4: Making the Entry
After identifying the setup, traders typically wait for the next candle to close before taking action.
Traders often place stop-loss levels just beyond the engulfing candle—below its low in bullish setups and above its high in bearish ones. As engulfing patterns don’t offer specific price targets, traders tend to use nearby support or resistance levels or prior swing highs and lows for exits.
Is engulfing strategy good? The engulfing approach is straightforward, making it a popular candlestick method among traders. While not foolproof, it is widely used when combined with sound market context and confirmation tools. Its strength lies in reflecting real shifts in momentum—moments when sentiment in the market genuinely changes direction.
Live Market Examples
If you want to follow along, you may consider using the TickTrader platform.
Bullish engulfing: On the GBP/USD chart, there is a bullish engulfing formation, signalling a downtrend reversal. The small red candle indicated a market downturn, but it was swiftly overshadowed by the subsequent green candle.
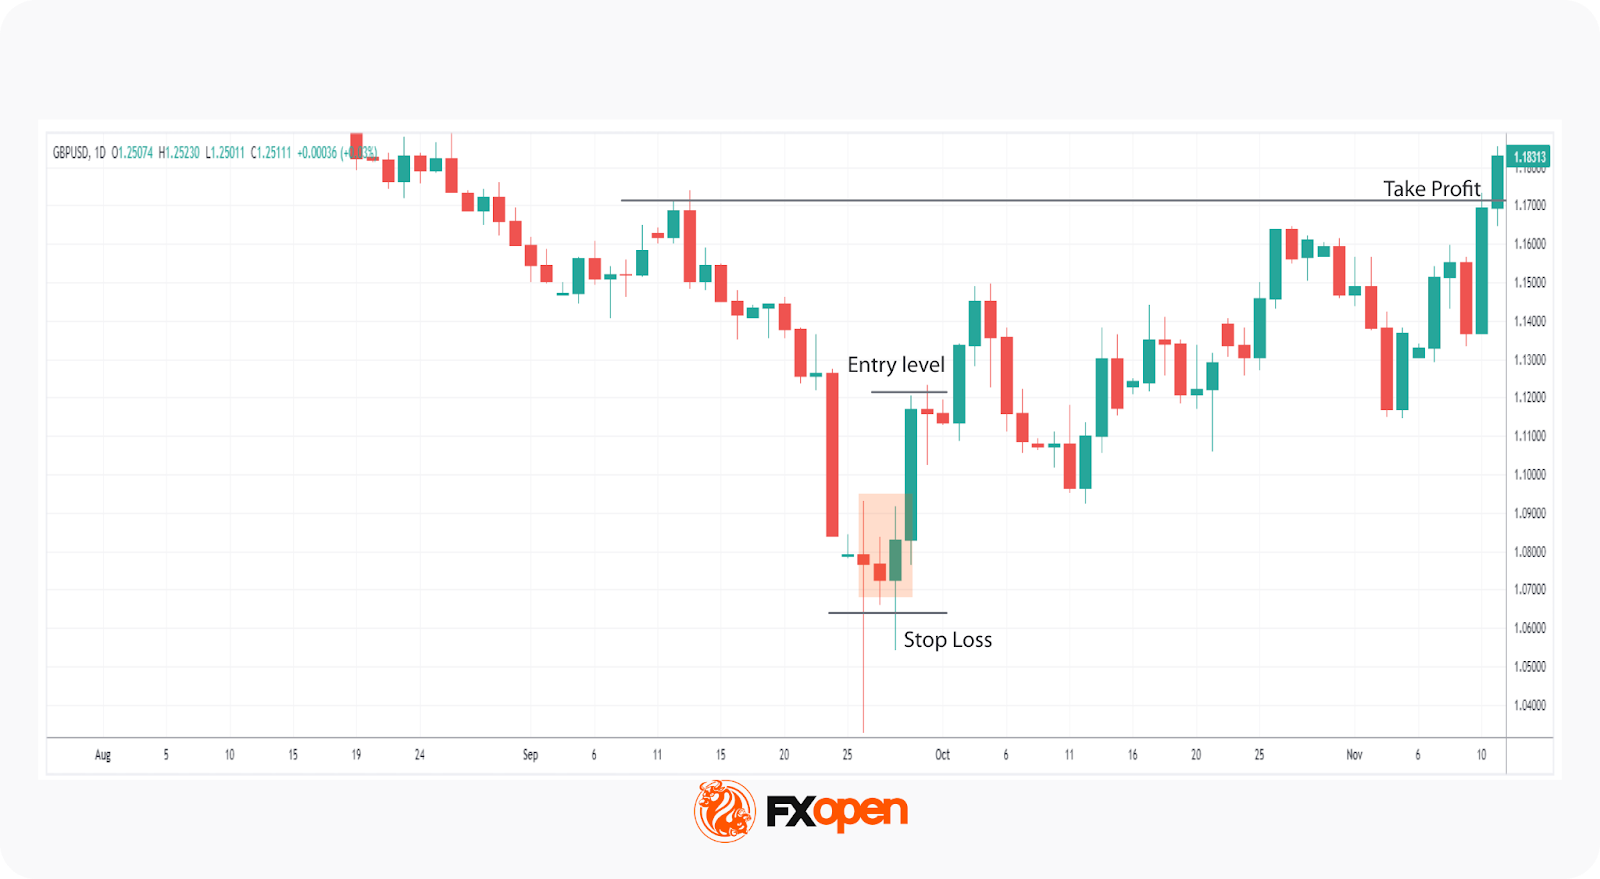
This shift signalled a weakening of sellers’ control and the emergence of strong buying momentum. Traders could have entered the market after the candle following the pattern closed and placed profit targets near the closest resistance level or at the origin of the previous bearish wave. The stop-loss could have been positioned just below the open of the bullish candle. Typically, traders place their stop loss below the low of the candle, but in this case, this rule would result in a poor risk-reward ratio.
Bearish engulfing: The chart illustrates an established uptrend concluding with a small green candle, which is subsequently engulfed by a larger red candle—an indication of a bearish engulfing formation. This dominant red candle signaled the end of the prevailing upward momentum and the beginning of a downward reversal.
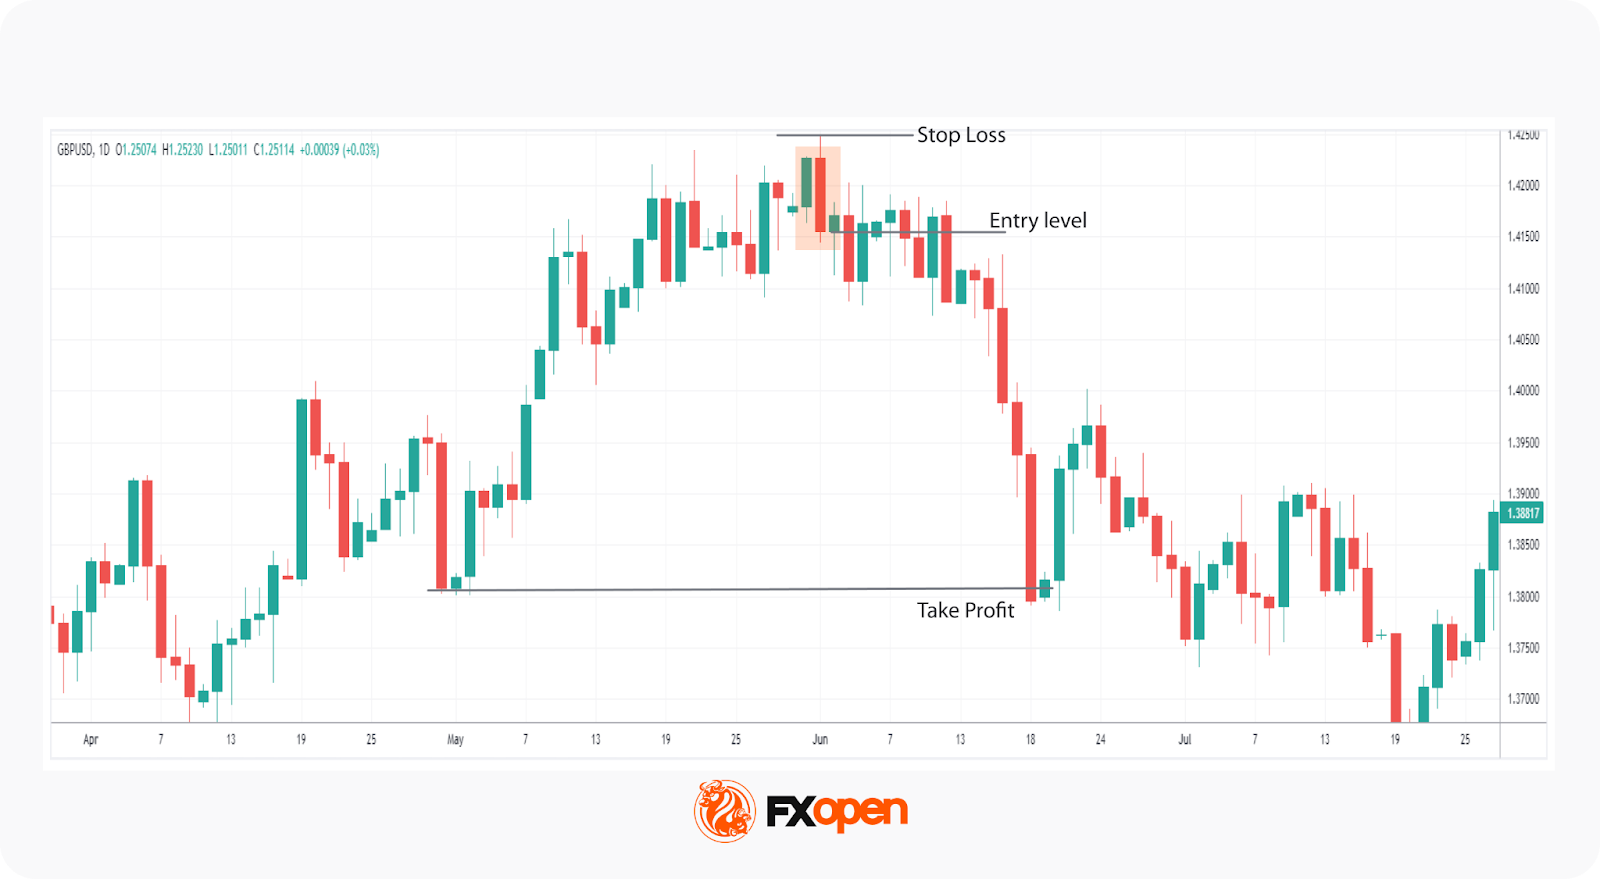
This change can be attributed to an influx of sellers downward pressure. In reaction to this, traders, anticipating further decline, drove down prices. Traders could have entered the market after the candles following the pattern closed downwards. They could have set a profit target at the closest support level. A stop-loss level could have been placed above the high of the bearish candle.
How May You Confirm an Engulfing Pattern?
Not every engulfing formation signals a true reversal. Confirmation may help separate meaningful setups from false starts. Traders typically combine price action cues and technical indicators to validate what the pattern implies. Here are several ways traders use to confirm an engulfing setup:
1. Volume Surge
An increase in trading volume during the engulfing candle often reinforces the strength of the move. High volume suggests that more participants are backing the reversal, adding weight to the signal.
2. Break of Structure
If price breaks a recent swing high after a bullish engulfing, or a swing low after a bearish one, it supports the idea of a shift in market control. This shows the market is moving beyond short-term noise.
3. Retest of Key Level
Sometimes, price revisits a support or resistance zone after forming an engulfing pattern. A rejection from that area may add credibility to the setup and provide a structure for trade planning.
4. Confluence with Indicators
Indicators like oscillators can confirm momentum change. For example, if a bullish engulfing forms while RSI rises from oversold levels, it aligns with the reversal narrative.
Confirmation doesn’t guarantee results, but it may filter out weak signals.
Important Considerations when Trading the Engulfing Pattern
Engulfing setups can be powerful signals, but context and confirmation matter.
1. Market Context
Engulfing formations carry more weight when they appear at significant turning points—such as near key support, resistance, or after a prolonged trend. Random engulfing candles in choppy markets are often noise rather than meaningful reversals.
2. Candle Proportion and Clarity
The second candle should clearly engulf the first. If the overlap is small or the wicks dominate, the signal loses strength. Clean, decisive candles tend to indicate stronger momentum shifts.
3. Timeframe Significance
Higher timeframes, such as daily or four-hour charts, often produce more dependable engulfing patterns than lower ones. Intraday charts can show false signals due to short-term volatility.
4. Combining with Broader Analysis
Engulfing setups are typically used alongside broader technical tools. When multiple signals point in the same direction, the likelihood of a valid reversal may increase.
Conclusion
Engulfing patterns are widely-used tools for identifying potential market reversals and timing entries. However, traders always confirm them with trend analysis, volume, and key support or resistance levels. When integrated into a broader technical strategy, these formations may help traders anticipate shifts in market sentiment. Applied consistently with disciplined risk management, engulfing candles can support traders when making trading decisions across forex, equities, and commodity markets.
If you want to trade in over 700 markets with tight spreads from 0.0 pips and low commissions from $1.50 per lot, you may consider opening an FXOpen account.
FAQ
What Is an Engulfing Pattern?
An engulfing pattern is a two-candle formation where the second candle fully covers the first, signalling a possible shift in market direction. There are two forms of the engulfing candles: bearish, which appears at the end of an uptrend and signals a downward reversal, and bullish, which forms at the end of a downtrend and signals an upward reversal.
How May Traders Use an Engulfing Pattern?
Traders use engulfing formations to spot potential reversals, often confirming them with other tools like support and resistance or momentum indicators.
What Timeframe Is the Most Popular for Engulfing Setups?
Daily and four-hour charts are the most popular, as they filter out short-term market noise and show stronger sentiment shifts.
How May Traders Enter Bullish Engulfing?
Traders typically act after a bullish engulfing forms at the end of a downtrend, waiting for the next candle to close for confirmation.
Is Bullish Engulfing Buy or Sell?
A bullish engulfing pattern is associated with a potential buy setup, showing that buyers are regaining control after a period of selling.
Is Bearish Engulfing Buy or Sell?
A bearish engulfing pattern is linked to a potential sell setup, suggesting sellers are overpowering buyers and momentum may be turning downward.
This article represents the opinion of the Companies operating under the FXOpen brand only. It is not to be construed as an offer, solicitation, or recommendation with respect to products and services provided by the Companies operating under the FXOpen brand, nor is it to be considered financial advice.
Stay ahead of the market!
Subscribe now to our mailing list and receive the latest market news and insights delivered directly to your inbox.


Latest articles

Weekly Market Insights with Gary Thomson: The Week of Central Banks and Earnings
In this video, we’ll explore the key economic events and market trends, shaping the financial landscape. Get ready for insights into financial markets to help you navigate the week ahead. Let’s dive in!
In this episode of Market

Intel at a Crossroads: Earnings Beat Meets Technical Resistance
Intel has just delivered its strongest quarter in over fifteen years, and the market reaction says it all. Q2 2026 revenue surged 25% year-over-year to $16.1 billion, crushing the consensus estimate of $14.42 billion, while adjusted EPS of

Tesla: Complex Range Structure Breaks Down Following Quarterly Earnings
Tesla released its Q2 2026 results after the market closed on 22 July. Revenue increased 26% year-on-year to $28.24 billion, while vehicle deliveries reached a record 480,126 units. However, operating margin fell sharply to 1.4%, down from