


Envelopes Indicator: A Powerful Tool for Market Analysis
FXOpen

When it comes to technical analysis, traders and investors rely on a variety of tools to help them make informed decisions. One popular tool in their arsenal is the envelopes indicator. This helps identify potential buy and sell signals, overbought or oversold conditions, and trend directions. In this FXOpen blog post, we will explore envelopes, their settings, use cases, limitations, and significance in trading strategies.
What Is the Envelopes Indicator?
The envelopes indicator is a technical analysis tool used in financial markets. It analyses price movements to identify potential trading opportunities.
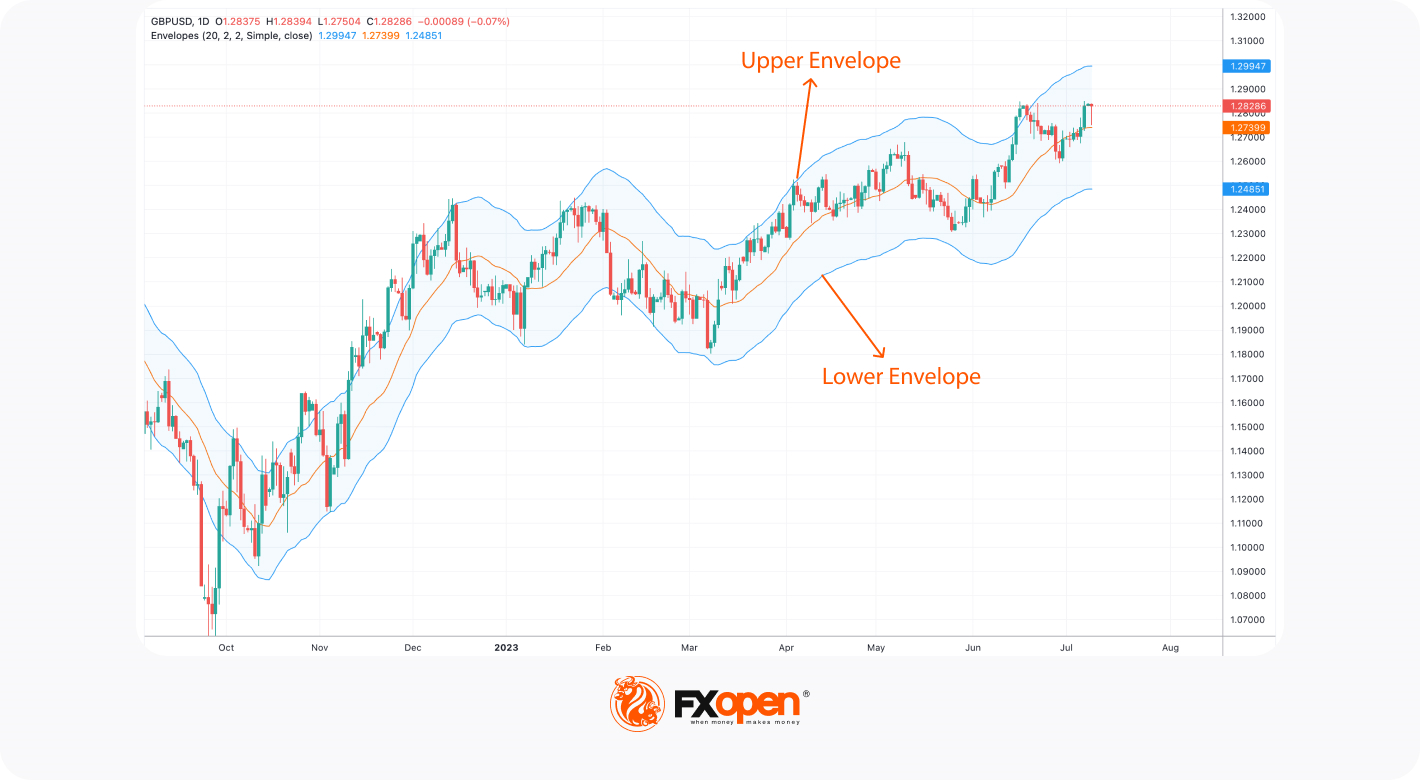
It consists of two main lines plotted above and below a moving average. These lines form a channel or envelope around the MA. The upper and lower lines are placed at a certain distance, expressed as a percentage or a fixed value, away from the moving average.
The upper envelope line represents a level of resistance, while the lower line is a level of support. Traders and analysts observe the interaction between the price and the envelopes lines to make trading decisions.
You can use the envelopes indicator in forex, stock, and commodity markets.
Settings
Before we dive into how the indicator works, let's first understand the envelopes indicator settings that traders adjust to make it suitable for their preferences and trading styles.
Length
The length determines the number of periods used to calculate the moving average for this tool. It is an essential parameter as it affects the sensitivity of the indicator. A shorter length will result in more frequent signals, while a longer length will generate fewer but potentially stronger signals.
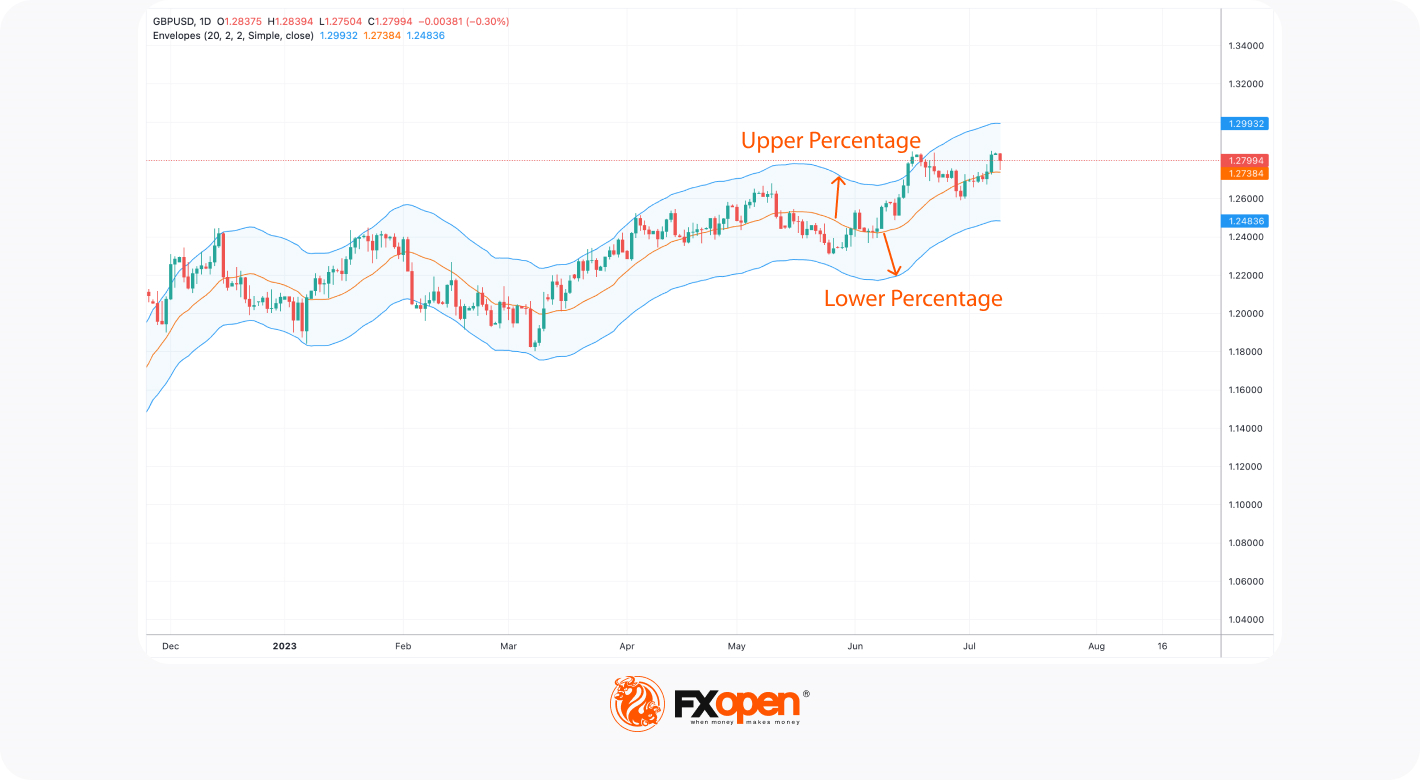
Upper Percentage
The upper percentage determines the distance between the upper envelope and the MA line. It is expressed as a percentage, allowing traders to customise the indicator based on their risk tolerance and the prevailing market conditions.
A higher upper percentage will create wider envelopes, more suitable for assets with higher volatility, while a lower percentage will result in narrower envelopes that suit instruments with small price fluctuations.
Lower Percentage
Similarly, the lower percentage determines the distance of the lower envelope from the MA line.
Like with the upper line, a higher percentage will generate wider envelopes, accommodating more price fluctuations, while a lower percentage will create narrower envelopes.
Method
The method determines the calculation techniques used to derive the moving average for the envelopes. The standard envelopes indicator shows the simple moving average (SMA), but traders can apply an exponential moving average (EMA) or weighted moving average (WMA).
You can choose the desired MA on FXOpen’s TickTrader platform. Examine different settings for free to identify the one that best aligns with your trading strategy.
Source
The source refers to the price data used to calculate the moving average. Traders can choose from close, high, low, and open prices. The selection of the price source impacts the indicator's performance. The most common setting is close prices; however, other methods can work better in specific markets.
Calculating the Envelopes
Now that we understand the settings of the envelopes let's explore how the indicator is calculated.
Upper Envelope: n-period SMA + (n-period SMA x %)
Lower Envelope: n-period SMA - (n-period SMA x %)
Where:
- N is the number of periods
- % is the percentage that determines the width of the envelopes
To calculate the upper line, you need to multiply the moving average by a percentage and add it to itself. Conversely, when calculating the lower envelope you will need to subtract the percentage of the MA from itself.
How Does the Envelopes Indicator Work?
The envelopes trading indicator offers valuable insights into the market by providing buy/sell signals, highlighting overbought or oversold conditions, and indicating the trend direction. Therefore, it is crucial for traders to know how to read the MA envelopes indicator before jumping into the market.
Buy/Sell Signals
The envelopes provide valuable signals for traders. When the price surpasses the upper boundary, it suggests a possible opportunity to sell. On the other hand, if the price drops below the lower level, it indicates a potential buying opportunity. Additionally, traders pay attention to the moving average breakouts. A price rise above the moving average is seen as a favourable time to buy, while a price decline below it is typically interpreted as an expectation of a market decline.
Traders can use these signals as an indication to enter or exit trades, but it is crucial to consider other supporting tools or analyses to confirm it.

Overbought/Oversold Conditions
The envelopes also help identify overbought or oversold conditions. When the price consistently touches or exceeds the upper line, it suggests that the market may be overbought, indicating a potential reversal or correction.
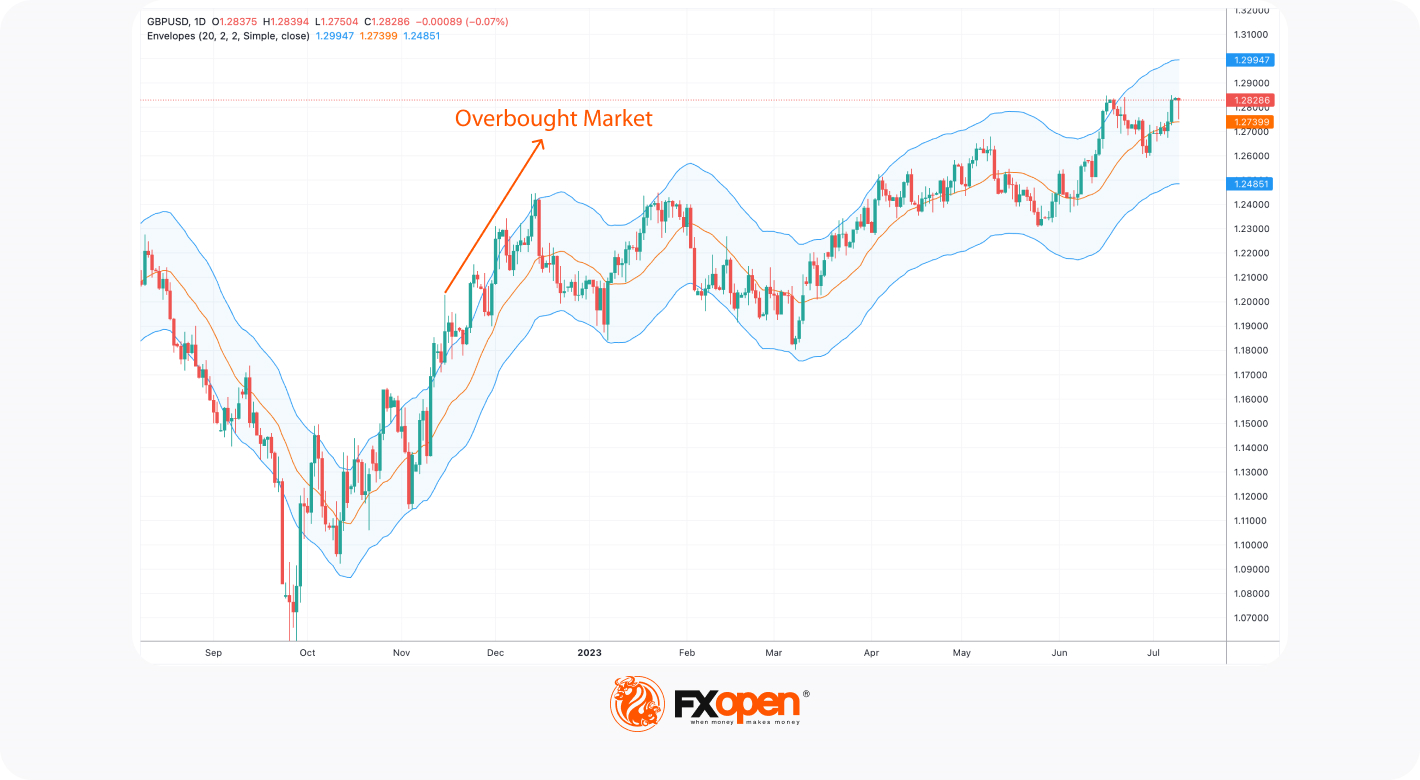
On the other hand, when the price consistently touches or falls below the lower envelope, it suggests that the market may be oversold, indicating a potential upward price movement.

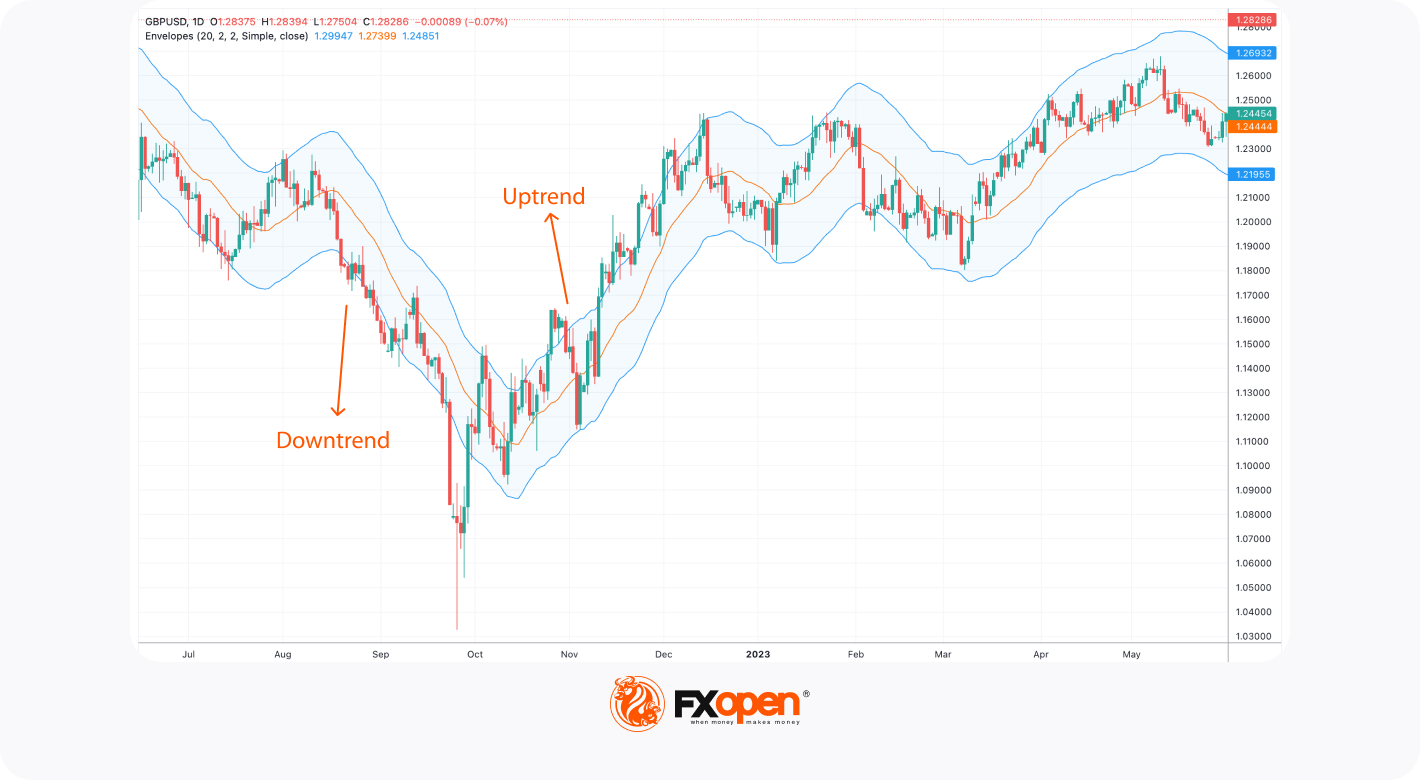
Trend Direction
By analysing the position and slope of the envelopes, traders can gain insights into the prevailing trend direction. If the price consistently stays above the moving average and the envelopes widen, it suggests an uptrend.
Conversely, if the price consistently stays below the moving average and the envelopes widen, it suggests a downtrend. Traders can use this information to align their trades with the overall market trend.
Limitations of the Envelopes Indicator
While the envelopes offer valuable information, it is essential to acknowledge their limitations. Like any technical analysis tool, it is not infallible and should not be used in isolation.
False Signals
The trend envelopes indicator can generate false signals, especially in choppy or sideways markets. Traders should consider combining it with other tools or analysis techniques to increase its effectiveness.
Adaptability
The indicator's settings may need adjustment depending on the market conditions and the timeframe being analysed. A setting that works well for one market or timeframe may not perform optimally in another.
Market Volatility
The indicator's sensitivity to market volatility can lead to whipsaws or premature exits. Traders should exercise caution and consider incorporating additional filters or confirmation signals to mitigate this risk.
Also, opening an FXOpen account can greatly help your trade management. The broker has strong regulations and an integrated trading platform, and you can enjoy trading without any hassle.
Conclusion
The moving average envelopes indicator is a versatile tool that provides traders with valuable insights into potential buy/sell signals, overbought/oversold conditions, and market direction. By adjusting the indicator's settings and combining it with other analysis techniques, traders can enhance their decision-making processes and improve their trading strategies. However, it is crucial to consider its limitations and utilise it with other tools to make well-informed trading decisions.
This article represents the opinion of the Companies operating under the FXOpen brand only. It is not to be construed as an offer, solicitation, or recommendation with respect to products and services provided by the Companies operating under the FXOpen brand, nor is it to be considered financial advice.
Stay ahead of the market!
Subscribe now to our mailing list and receive the latest market news and insights delivered directly to your inbox.


Latest articles

EUR/USD Analysis: Who Is in Control?
Two central banks, two hawkish tones — but only one dollar just took a hit. The ECB delivered a 25bp hike in June, its first since 2023, lifting the deposit rate to 2.25% as Middle East-driven energy costs pushed headline

Gold Resumes Its Advance Following the US Labour Market Report
Gold is attempting to break its medium-term trend, with the latest US labour market data acting as the main catalyst. The US employment report released on 2 July came in noticeably weaker than expected, with the pace of hiring slowing

NZD/CHF Analysis: Which Currency Breaks the Consolidation First?
NZD/CHF remains locked in a tight range as traders await the next monetary policy catalyst.
The Reserve Bank of New Zealand heads into Wednesday's meeting on shaky ground. After May's 3-3 split was resolved by a casting vote, the