Ether Bounces at Support, Dash Down Again
Another two weeks of red for both Ethereum and Dash. Ether is down by close to 15 percent while Dash is heading back down. Let’s start with ETH/BTC and we’ll get back to Dash later in the article.
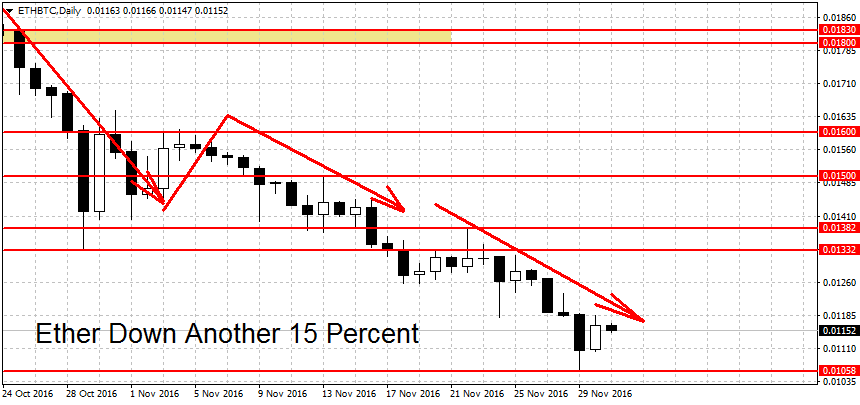
Ether Down Almost 15 Percent
Another two grueling weeks for ETH bulls as prices continue to head lower. We are currently quoted at 0.01152, 14.6 percent below the price noted during our previous update.
The downtrend is still firmly in place in this pair. To end it, the bulls will have to stage a breakout above the 0.01382 swing high. Slightly below here we find another strong resistance at 0.01332. This is the October low in ETH/BTC which acted as support during November. Support becomes resistance and this level will likely put pressure on rising prices. The threshold to starting a new Ether rally is set even higher at the 0.015 round figure. You can see more of the levels to the upside on our chart.
On the lower end we have support at the November lows of 0.01058, closely followed by the round 0.01 figure. A decisive break below here could intensify the losses. Ethereum is a relatively new coin, so there’s not much in the form of previous support levels below here. The semi-round figure at 0.05 may also act as support but other then that, it’s enough’s guess where prices may stall or bottom out.
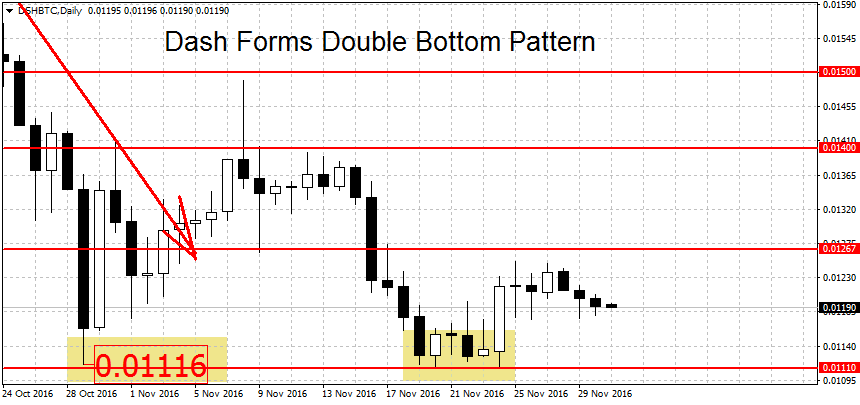
Dash Heading Down Again
After a short respite, Dash is heading lower again. We’re trading at 0.01190 right now, 5.8 percent lower compared to two weeks ago. As we can see on the chart below, prices tested October’s low at 0.01116 but were quickly repelled after a brief excursion to 0.01110.
With this move DSH/BTC has now formed a double bottom pattern. Further confirmation is needed however. A decisive break below the 0.0111 lows would invalidate the pattern and start a new downtrend. Below here we have more support at the 0.01 round figure.
On the other end, a breakout above 0.014 is needed to start a new uptrend. Resistance above here can be found at the 0.01489 swing high, followed by the round figure at 0.015. We have more resistance above here at the September lows of 0.01741 per BTC, closely followed by the 0.01822 swing low and the 0.02 round figure.