


What Is the Double Bottom (W) Pattern, and How May Traders Use It?
FXOpen

The double bottom, often called the W pattern, is a chart formation that signals a potential trend reversal. It is the opposite of the double top pattern: while the double top forms in an uptrend, the double bottom develops in a downtrend. Traders sometimes confuse the two, but each has distinct characteristics. Read this article to explore the features of the double bottom and how it might be applied in trading strategies.
What Is a Double Bottom Chart Pattern?
A double bottom, also referred to as a W bottom pattern, is a technical analysis formation indicating a potential reversal from a downtrend to an uptrend. It is widely used by traders to define future price movements.
The pattern consists of two distinct troughs or lows at approximately the same price level, separated by a peak or moderate rally. The confirmation of the W formation occurs when the price breaks above the peak level, known as the neckline. This breakout signals a bullish reversal, indicating that the asset's price is likely to rise.
Must the two bottoms be the same? No, the two bottoms in a double bottom do not need to be exactly the same, but they should be close to each other. This slight variation is acceptable and still indicates a significant support level. A higher second bottom can suggest diminishing selling pressure, highlighting the first low as a stronger support point. Despite this variability, identical lows are often considered a stronger signal of a bullish reversal.
A double bottom reversal reveals diminishing selling pressure and growing buying interest, with the potential to kickstart a new bullish trend. The pattern forms when sellers fail to push the price lower after the first low, suggesting weakening bearish momentum. The second low at a similar level shows strong support, leading buyers to enter the market. This shift in sentiment pushes the price up.
A forex double bottom setup is the same as those seen in stocks, commodities, and cryptocurrencies*. Therefore, after you learn this pattern, you can trade it at FXOpen via stock, cryptocurrency*, commodity, and forex CFDs.
A Double Bottom and a Double Top: Differences
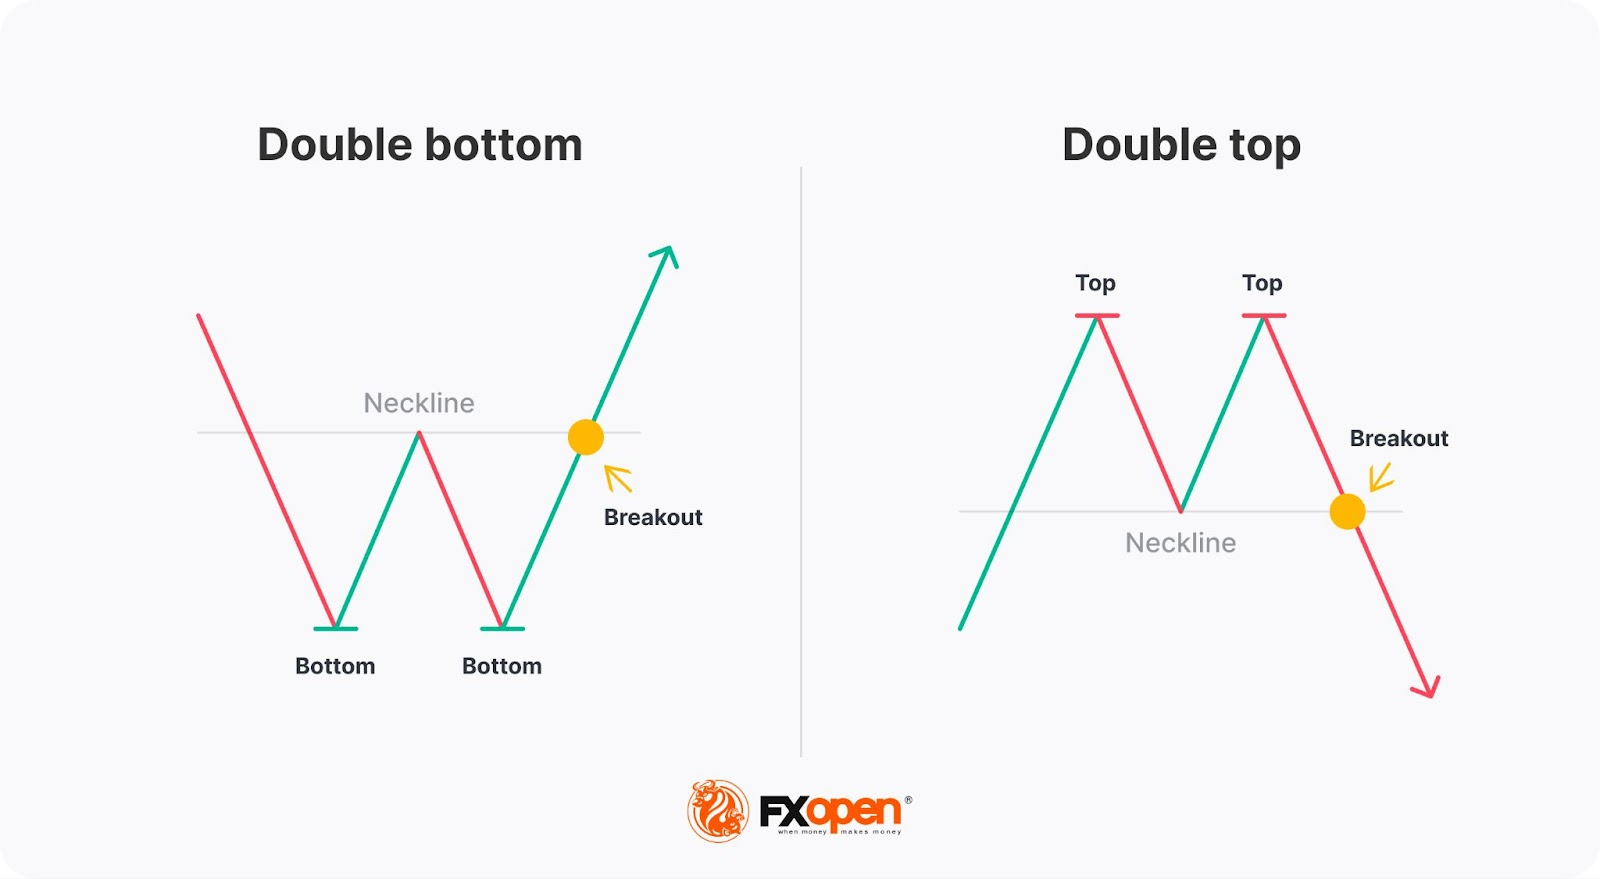
A double top pattern signifies an uptrend's end and a potential downward reversal. It appears at the end of a strong uptrend. The first top stands for an uptrend continuation, while the second, formed at the same level, signals the buyers' weakness.
For a deeper understanding of double tops, refer to our detailed article on the pattern.
Remember that a double bottom setup won't work in an upward trend, while a double top setup can't be found in a downtrend.
Double Bottom Breakout Strategy
The idea behind the double bottom is to enter a market on the breakout of a neckline, a line drawn through a peak between two bottoms. The same idea applies to many patterns, including double top, triple top, triple bottom, head and shoulders, inverse head and shoulders, and Quasimodo.
Entry
Initially, a trader identifies the double bottom on a chart by spotting two similar lows separated by a peak. They then draw a neckline through the peak and wait for the price to break above this line after the second bottom is formed, known as a double bottom breakout.
A trader could open a position as soon as the price rises above the neckline. In this case, the risks are high because the price often retests the breakout level, like in flag, triangle, and wedge setups.
Another approach is to wait for either a breakout candlestick or several candlesticks to close. On the charts with long periods, a trader typically waits for the price to form a few candles. However, if the timeframe isn’t high and the distance between the bottoms and the neckline is small, a trader may open a position too late, which will result in either small potential returns or a lack of them.
Take Profit
A take-profit target is equal to the distance between the bottoms and the neckline and is set just from the neckline. A trader may use a trailing take-profit order if the market sentiment is bullish and there are fundamental factors that can push the price up.
Stop Loss
A stop-loss level can be calculated with a risk/reward ratio. The most common ratios are 1:2 and 1:3, but traders can develop their own trading rules.
Double Bottom: Trading Examples
Let’s consider an example of a potential double bottom trade.
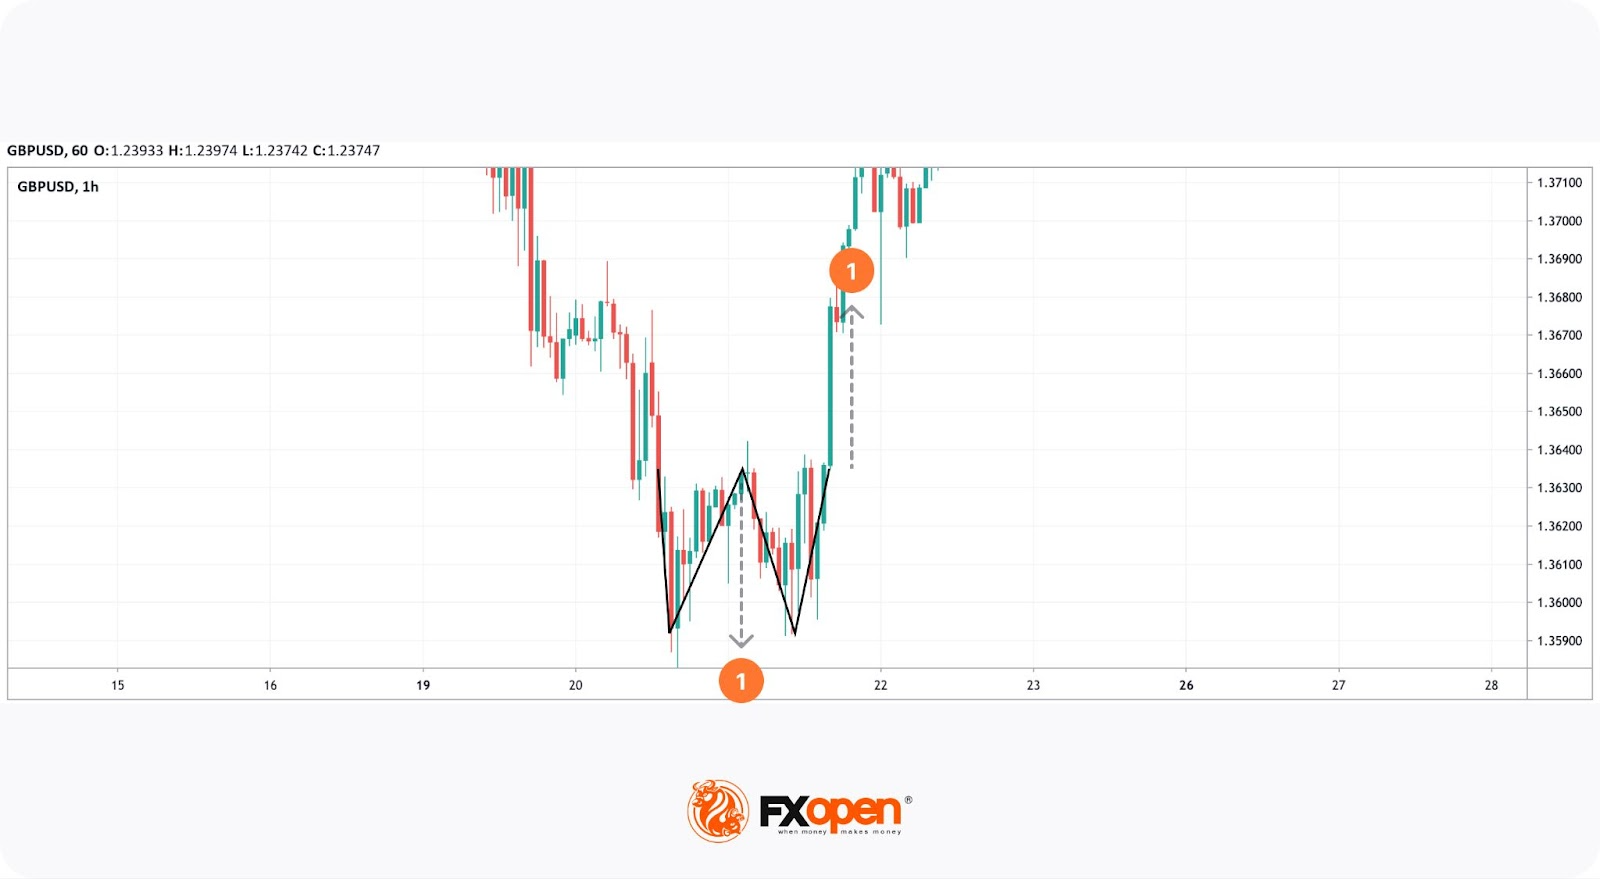
On the chart above, the price formed a double bottom setup at the end of a downtrend. According to the common rule, the price moved the distance equal to the difference between the neckline and the bottoms (1). If a trader waited for the breakout candlestick to close, they would miss the trade with the pattern. Therefore, when noticing a large trading volume, a trader could go long at any time the breakout candle was forming.
A take-profit target would equal the distance between the neckline and the bottoms regardless of the entry point. However, as the rise continued, a trader could trail a take-profit level. The stop-loss would depend on the entry point and the take-profit level, but a 1:2 or 1:3 risk/reward ratio is common.
Confirmation Tools for a Double Bottom Chart Pattern
A double bottom setup can be confirmed with standard technical analysis tools. As a trader uses a breakout to enter the market with this formation, trading volumes can be used as a barometer of the bulls' strength. If trading volumes grow when the price rises above the neckline, the price is more likely to continue surging.
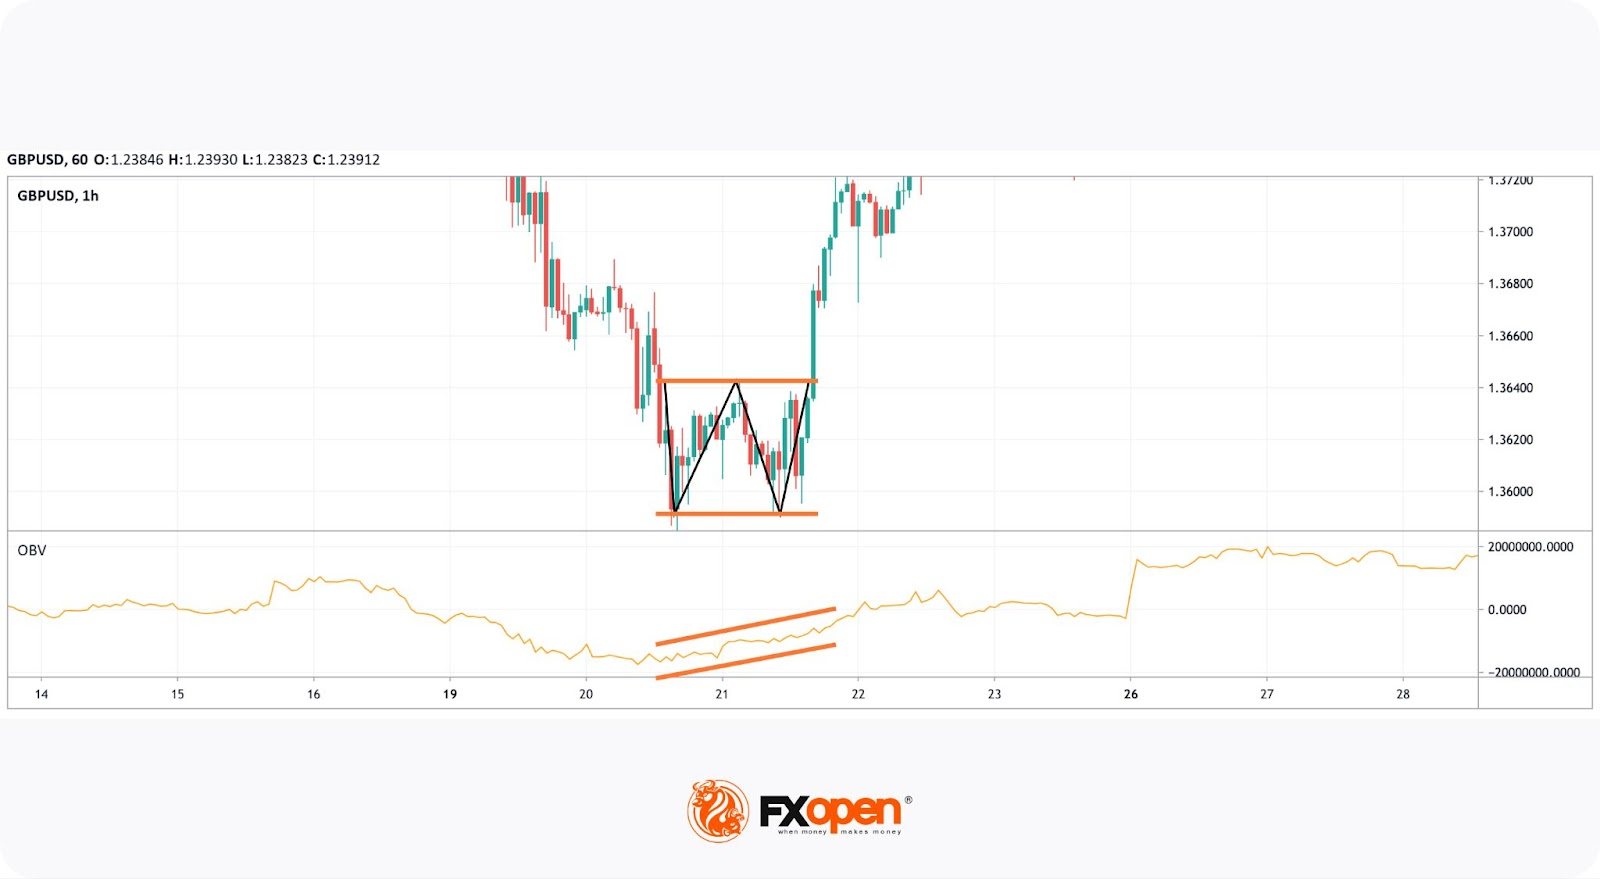
On the chart above, the on-balance volume (OBV) indicator is growing, although the price is consolidating. It’s the first sign the price will break above the neckline and keep rising.
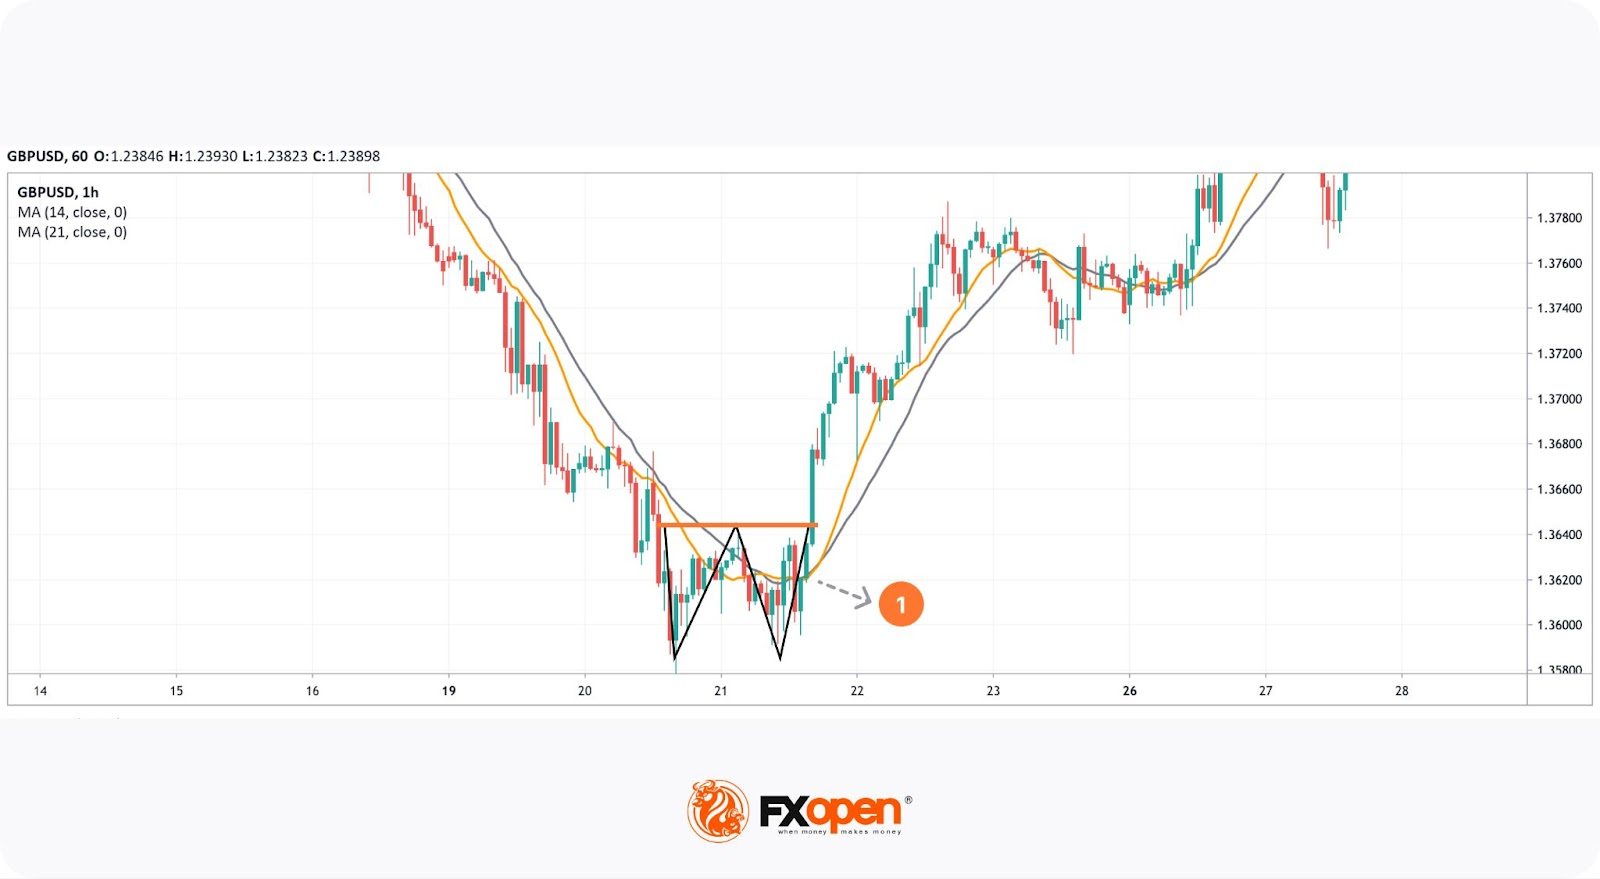
Another option is to use trend indicators. For instance, traders can apply moving averages to the price chart to find a well-known golden cross signal. In the picture above, moving averages formed a golden cross (1), which signalled a price rise. A trader could use it to confirm a breakout.
Note: Most of the trend indicators are lagging, meaning they provide delayed signals. Therefore, if you implement them when trading on a short-period chart, it’s worth changing their parameters to smaller values.
If you want to try different indicators and candlestick patterns that might help you confirm the double bottom signals, consider using the TickTrader platform and access over 1,200 trading tools.
Final Thoughts
The double bottom is a widely recognised reversal formation that may support traders when analysing potential changes in market direction. While its W-shaped structure is straightforward, traders usually confirm the pattern with volume, support/resistance levels, or other technical analysis tools.
If you want to implement the double bottom formation into your trading strategy, consider opening an FXOpen account and access tight spreads from 0.0 pips and low commissions from $1.50 per lot. Good luck!
FAQ
What Is a Double Bottom in Trading?
The double bottom is a chart pattern used in technical analysis to determine a potential reversal in a downward trend. It consists of two distinct lows at approximately the same price level, separated by a peak. This formation indicates that selling pressure is subsiding and buying interest is growing.
What Does a Double Bottom Indicate?
A double bottom indicates a potential bullish reversal in the market. It shows that the asset's price has hit a support level twice and failed to go lower, suggesting that selling pressure is diminishing and a trend change is likely as buyers step in.
How May Traders Identify a W Pattern?
To identify a W pattern, traders look for two lows forming at roughly the same price level, separated by a peak. They draw a neckline through the peak, and watch for the price to break above it after the second bottom is formed. This breakout confirms the pattern and signals a potential trend reversal.
Is the W Pattern Bullish or Bearish?
The W pattern in trading is bullish. It indicates that the asset's price is likely to rise after completing the pattern, signalling a reversal from a downtrend to an uptrend.
What Is Double Bottom in Stocks?
A double bottom stock pattern, or W stock pattern, indicates the potential end of a downtrend in a stock price. It is formed when a stock's price drops to a support level, rebounds, and then drops again to the same level before rising. This formation suggests that the stock's value may continue to increase.
What Is the W Pattern in Crypto*?
The W or double bottom pattern in crypto* functions similarly to other markets. It indicates a potential reversal in a cryptocurrency's* downtrend. When the price forms two lows at a similar level, separated by a peak, and breaks above the neckline drawn through that peak, it signals that the bearish trend may be ending, and a bullish trend could follow.
*Important: At FXOpen UK, Cryptocurrency trading via CFDs is only available to our Professional clients. They are not available for trading by Retail clients. To find out more information about how this may affect you, please get in touch with our team.
This article represents the opinion of the Companies operating under the FXOpen brand only. It is not to be construed as an offer, solicitation, or recommendation with respect to products and services provided by the Companies operating under the FXOpen brand, nor is it to be considered financial advice.
Stay ahead of the market!
Subscribe now to our mailing list and receive the latest market news and insights delivered directly to your inbox.


Latest articles

US Dollar Index: A Defining Week for the King of the Markets
The dollar heads into a pivotal week trading near 101.80, just off a 15-month high, with the Fed's July 29 meeting standing as the clear focal point. Markets currently price roughly a 65% chance of a hold, though renewed

NZD/USD: Inflation Surge Meets Strong US Dollar Pressure
On 21 July, Stats NZ reported an acceleration in inflation: the Consumer Price Index rose 1.5% in the second quarter, while the annual inflation rate climbed to 4.1%, its highest level in more than two years and slightly

Weekly Market Insights with Gary Thomson: The Week of Central Banks and Earnings
In this video, we’ll explore the key economic events and market trends, shaping the financial landscape. Get ready for insights into financial markets to help you navigate the week ahead. Let’s dive in!
In this episode of Market