


Ether Ends Rally, Dash Back in Range
FXOpen

Everything is back in a range this week, as both Ether and Dash are waiting for the next move. We also provide a short BTC update at the end of this article.
Ether Ends Rally
Ether prices continued the slow downtrend versus bitcoin. This has led to ETH/BTC finally ending the rally that started last month. We are currently quoted at 0.11927 BTC per 1 Ether, down from 0.1359 BTC two weeks ago. This is a decline of just above 13 percent.
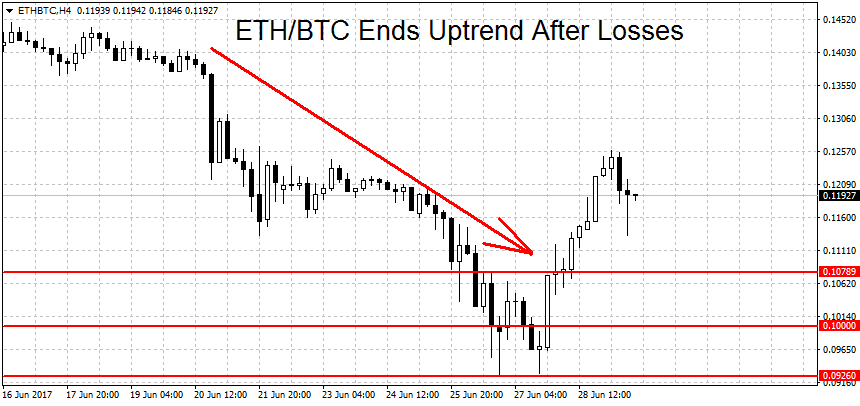
This puts Ether back in a range. A new uptrend needs a breakout above the all-time high at 0.1515 BTC while a new downtrend could commence on a clean move below this month’s low at 0.09272. For now, we are in ‘wait and see’ mode here. On the long-term charts ETH/BTC remains in an uptrend.
Fundamentally there is no one cause we can pin this latest rally on. It appears to be the classic case of prices going too far, too fast and then retracing violently. This manic-depressive market behavior was on full display at GDAX exchange last week. Prices here tumbled to a low of 10 cents during a flash crash caused by a cascade of margin calls. The crash made news at major media outlets. A stark reminder of the dangers of margin trading.
Dash Can’t Hold Gains
Initially, Dash prices successfully broke above the important 0.07 BTC level noted in our previous article. The breakout led to gains during which a high of 0.08 BTC was hit. But here the move stopped and reversed completely, with prices even dropping below the breakout point.
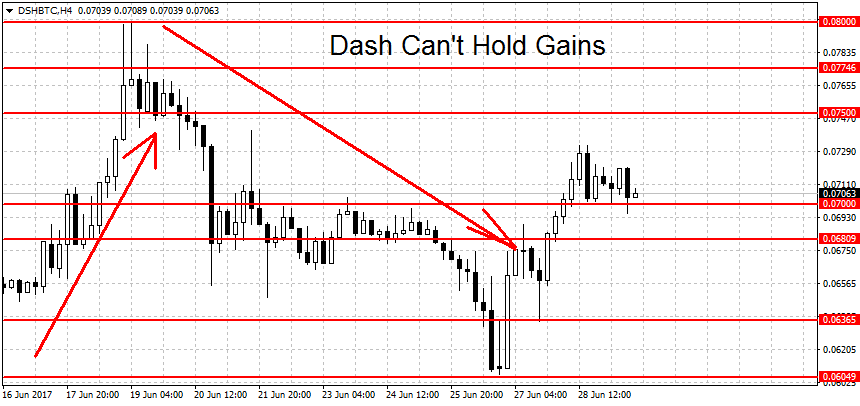
We are currently trading right around the previous resistance at 0.07063 BTC per coin. While prices are still slightly above the breakout point, the upward momentum has been completely lost. Dash is now back in a range.
A new rally needs a breakout above this month’s high at 0.08 BTC. A new downtrend is possible if we get a decisive break below the 0.05 round figure. Similarly to ETH we’re now playing the waiting game here. On the longer-term charts (weekly and monthly) DASH/BTC is still looking bullish.
Bitcoin Range-bound
Like the other two crypto-currencies above, big brother bitcoin is in a range as well. A new rally needs a breakout above the $2,890 level on FXOpen (or $3,000 on other major exchanges). On the other end, a move below the $2,250 swing low could start a new BTC downtrend.
FXOpen offers the world's most popular cryptocurrency CFDs*, including Bitcoin and Ethereum. Floating spreads, 1:2 leverage — at your service (additional fees may apply). Open your trading account now or learn more about crypto CFD trading with FXOpen.
*Important: At FXOpen UK, Cryptocurrency trading via CFDs is only available to our Professional clients. They are not available for trading by Retail clients. To find out more information about how this may affect you, please get in touch with our team.
This article represents the opinion of the Companies operating under the FXOpen brand only. It is not to be construed as an offer, solicitation, or recommendation with respect to products and services provided by the Companies operating under the FXOpen brand, nor is it to be considered financial advice.
Stay ahead of the market!
Subscribe now to our mailing list and receive the latest market news and insights delivered directly to your inbox.


Latest articles

USD/JPY and USD/CHF Near Key Levels: The Dollar Supported by the Fed
The US dollar continues to trend upwards following the Federal Reserve meeting, drawing support from the regulator’s moderately hawkish stance and comments by Jerome Powell. Markets interpret the Fed’s rhetoric as a signal that restrictive policy is likely

EUR/USD and GBP/USD consolidate ahead of the Fed decision
European currencies are showing subdued dynamics, entering a consolidation phase following their previous advance. Earlier, EUR/USD and GBP/USD broke out of their ranges and strengthened; however, the subsequent correction has led both pairs to retest the previously breached

Meta: V-Shaped Recovery Meets Heavy Volume Resistance
The movement in Meta Platforms shares is being driven by two competing narratives. On one hand, advertising revenue is benefiting from AI-based tools: the Advantage+ platform continues to support strong advertiser demand, and the analyst consensus for Q1 2026 revenue