


Ether Enters Downtrend
FXOpen
After a long period of consolidation, Ether entered a downtrend vs BTC. Meanwhile Dash continued the bearish trend from the week prior.
Ether Enters Downtrend
We finally got a decisive break of support in ETH/BTC. Earlier the pair tried to start a new downtrend but was rebuffed twice as bulls rallied us back above the 0.07 BTC mark. Yesterday we got a sharp break below the previous low at 0.06734 BTC and unlike previous times we kept going. Today a new two-month low of 0.06232 BTC was hit. We are currently quoted just above here at 0.06244 BTC.
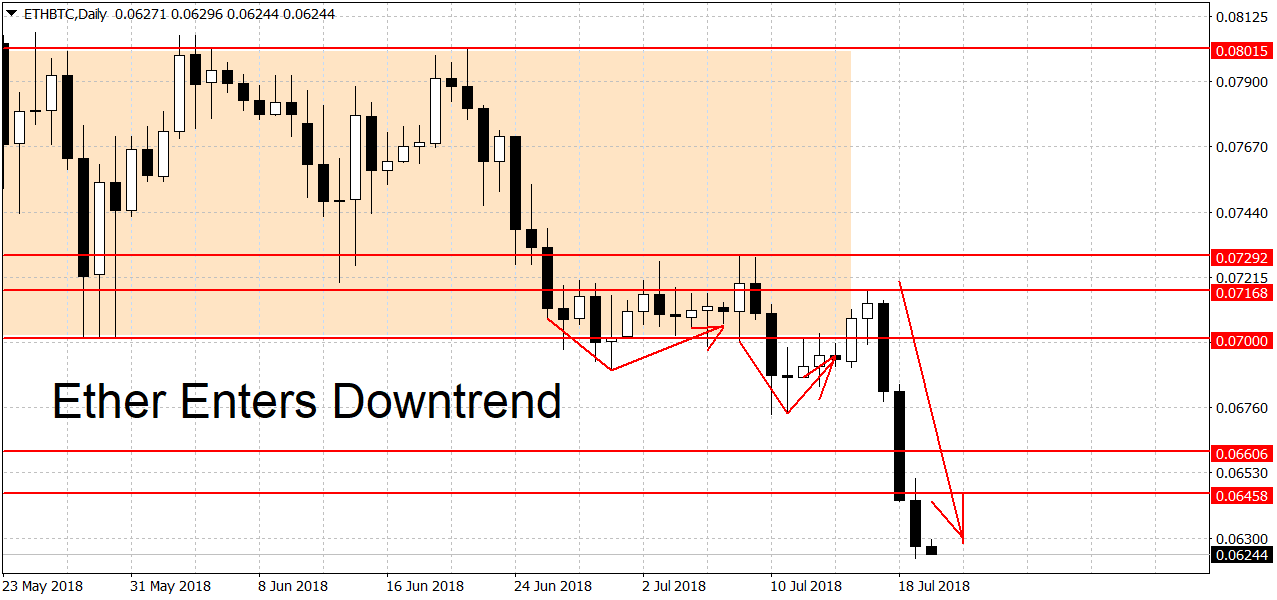
The trend on the daily charts is now down. To end it the bears will have to push us above the 0.07168 BTC swing high. A rally beyond 0.07292 BTC is needed to push us into bullish territory.
Below there’s weak support at yesterday’s low of 0.06232 BTC. Further down we have the former swing high at 0.05906 BTC. Lower still there’s the March low at 0.05240 BTC followed by the 0.05 round figure. This is a another possible area where the downtrend may stall or stop. On the longer-term charts the picture is little changed. We are still range-bound on the weeklies but bullish on the monthlies.
Dash Still Bearish
Price action in DSH/BTC is still looking bearish. The pair rallied to a high of 0.03852 BTC few days ago but has since pulled back. We are trading at 0.03465 BTC right now, not far from this year’s low of 0.03332 BTC.
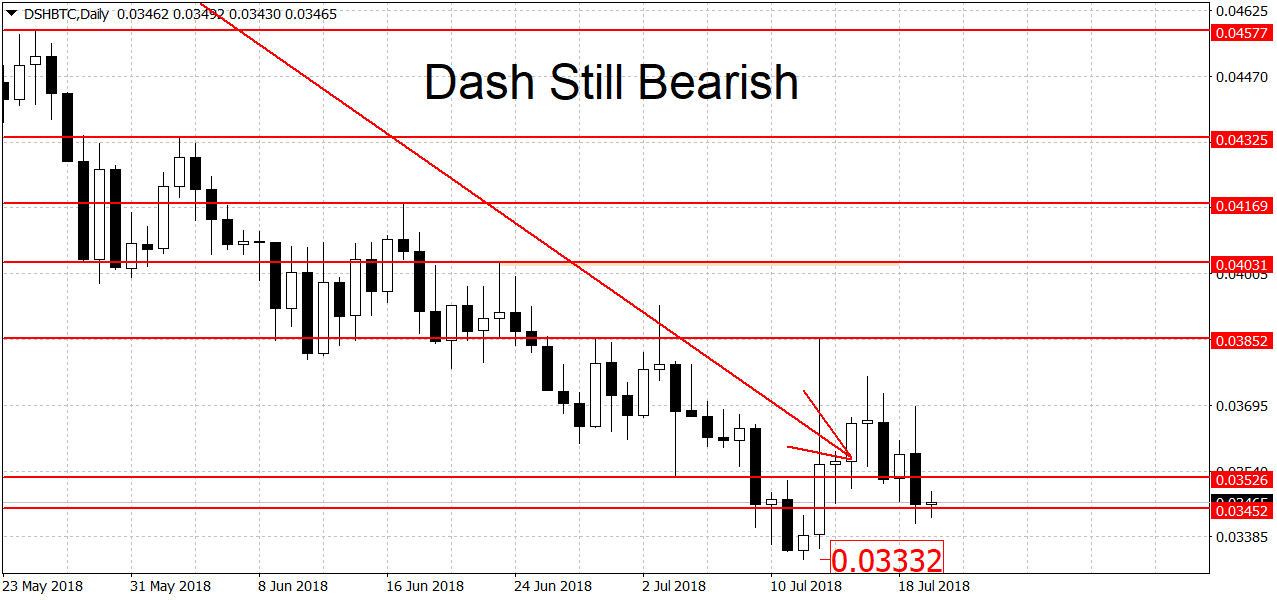
Despite the jump Dash failed to break above 0.03930 BTC. This is the level we set for the crypto as a potential trend-ender in our previous article. Therefore the pair remains in a downtrend. The bulls now need a breakout above 0.03852 BTC to end it.
A clean break above 0.04 BTC is needed to trigger a new rally. Some resistance higher up can be found at 0.4031 BTC, 0.04169 BTC, 0.04325 BTC and 0.04577 BTC. All of these were swing highs during the current downtrend. Higher still the 0.05 BTC round figure may also act as resistance to rising prices.
Below there’s some support around the 2018 low at 0.03332 BTC. Further down we have more support at 0.031 BTC, followed by the 0.03 BTC round figure. The 0.031 BTC swing high was a 2016 high for DSH/BTC that wasn’t broken until next year. Dash is also bearish on the weekly charts. The monthlies turned neutral this month.
Trade altcoins with FXOpen broker
FXOpen offers the world's most popular cryptocurrency CFDs*, including Bitcoin and Ethereum. Floating spreads, 1:2 leverage — at your service (additional fees may apply). Open your trading account now or learn more about crypto CFD trading with FXOpen.
*Important: At FXOpen UK, Cryptocurrency trading via CFDs is only available to our Professional clients. They are not available for trading by Retail clients. To find out more information about how this may affect you, please get in touch with our team.
This article represents the opinion of the Companies operating under the FXOpen brand only. It is not to be construed as an offer, solicitation, or recommendation with respect to products and services provided by the Companies operating under the FXOpen brand, nor is it to be considered financial advice.
Stay ahead of the market!
Subscribe now to our mailing list and receive the latest market news and insights delivered directly to your inbox.


Latest articles

EUR/USD and GBP/USD consolidate ahead of the Fed decision
European currencies are showing subdued dynamics, entering a consolidation phase following their previous advance. Earlier, EUR/USD and GBP/USD broke out of their ranges and strengthened; however, the subsequent correction has led both pairs to retest the previously breached

Meta: V-Shaped Recovery Meets Heavy Volume Resistance
The movement in Meta Platforms shares is being driven by two competing narratives. On one hand, advertising revenue is benefiting from AI-based tools: the Advantage+ platform continues to support strong advertiser demand, and the analyst consensus for Q1 2026 revenue

Commodity Currencies Test Key Levels Ahead of Major Macro Data
Commodity-linked currencies are trading near key levels, showing restrained price action as market participants adopt a wait-and-see approach. The fundamental backdrop is shaped by expectations surrounding the release of Australia’s inflation data and the Bank of Canada’s interest