


Ether in Range, Dash Still Down
FXOpen
The uptrend in ETH/BTC is finally over. With the most recent down move in crypto markets the pair entered a range during the past few days. Dash on the other hand is still in a bearish trend versus BTC.
Ether in Range
Ether prices are back in a range vs bitcoin on the daily charts. You can see this range marked with a yellow rectangle on the charts below. The pair dropped to a low of 0.07437 BTC earlier today during a bout of selling across the board. With a previous swing low at 0.07413 BTC, this formed somewhat of a double bottom.
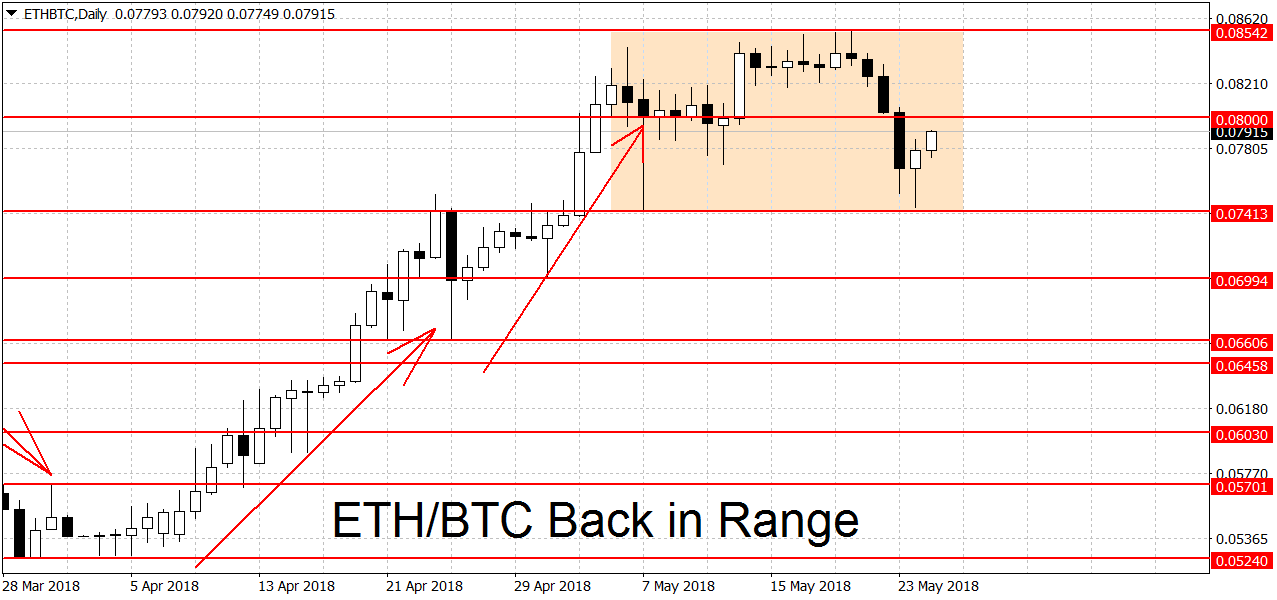
A clearing of this bottom would start a new downtrend in ETH/BTC. On the upside the bulls need a breakout above the most recent swing high at 0.08542 BTC. This could re-start the move higher. Resistance above can be found at the 0.08829 swing high and the 0.09 and 0.1 BTC round figures. A decisive breakout above here may open to door to this year’s high at 0.121 BTC. On the longer-term weekly charts Ether is also range-bound. The trend is bullish on the monthlies but these charts take a longer time to turn.
The major event today and the reason for selling in ETH and BTC was news that the U.S. Justice Department entered a criminal probe into crypto price manipulation. The article says that the investigation is focused on illegal practices that can influence prices such as spoofing, or flooding the market with fake orders to trick other traders into buying or selling. Bloomberg specifically lists BTC and ETH as some of the coin markets that are being investigated. This was probably the reason why the selling was concentrated in these two cryptos while some others fared better.
Dash Stays in a Downtrend
Dash prices are staying in a downtrend vs BTC. We are trading at 0.04528 right now, lower by 8.4 percent compared to last Thursday. To end the bearish trend the bulls still need a breakout above the latest swing high at 0.05161 BTC.
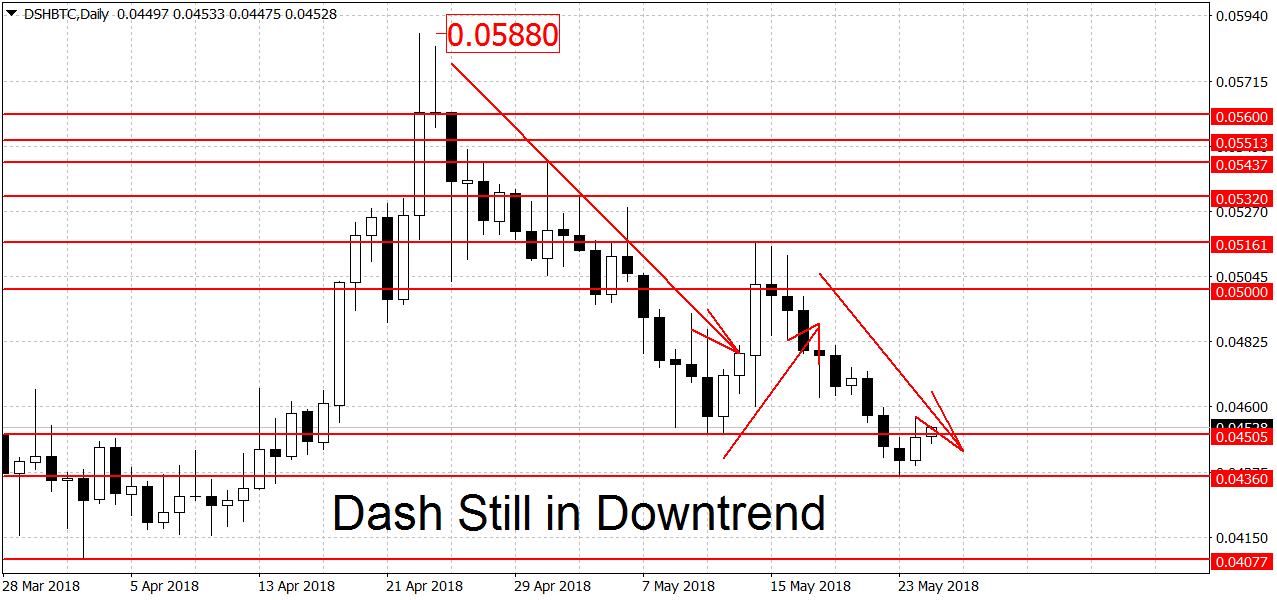
Weak support below can be found at yesterday’s low of 0.04360, followed by the 0.04077 swing low and the 0.04 BTC round figure. A clearing of this support area could extend the losses. On the longer-term weekly charts DSH/BTC is range-bound. The monthly charts are still looking bullish.
FXOpen offers the world's most popular cryptocurrency CFDs*, including Bitcoin and Ethereum. Floating spreads, 1:2 leverage — at your service (additional fees may apply). Open your trading account now or learn more about crypto CFD trading with FXOpen.
*Important: At FXOpen UK, Cryptocurrency trading via CFDs is only available to our Professional clients. They are not available for trading by Retail clients. To find out more information about how this may affect you, please get in touch with our team.
This article represents the opinion of the Companies operating under the FXOpen brand only. It is not to be construed as an offer, solicitation, or recommendation with respect to products and services provided by the Companies operating under the FXOpen brand, nor is it to be considered financial advice.
Stay ahead of the market!
Subscribe now to our mailing list and receive the latest market news and insights delivered directly to your inbox.


Latest articles

EUR/USD and GBP/USD consolidate ahead of the Fed decision
European currencies are showing subdued dynamics, entering a consolidation phase following their previous advance. Earlier, EUR/USD and GBP/USD broke out of their ranges and strengthened; however, the subsequent correction has led both pairs to retest the previously breached

Meta: V-Shaped Recovery Meets Heavy Volume Resistance
The movement in Meta Platforms shares is being driven by two competing narratives. On one hand, advertising revenue is benefiting from AI-based tools: the Advantage+ platform continues to support strong advertiser demand, and the analyst consensus for Q1 2026 revenue

Commodity Currencies Test Key Levels Ahead of Major Macro Data
Commodity-linked currencies are trading near key levels, showing restrained price action as market participants adopt a wait-and-see approach. The fundamental backdrop is shaped by expectations surrounding the release of Australia’s inflation data and the Bank of Canada’s interest