


FXOpen
The Euro and British Pound started a decent recovery against the Japanese Yen. Both EUR/JPY and GBP/JPY are likely to rise slowly and steadily in the short term.
Important Takeaways for EUR/JPY and GBP/JPY
- The Euro grinded higher recently after forming a bottom near the 124.90 level against the Japanese Yen.
- There is a crucial bullish trend line in place with support at 127.60 on the 4-hours chart.
- GBP/JPY moved above the 141.80 and 142.00 resistances, which is a positive sign.
- The pair could correct lower, but it is likely to resume its upside above the 143.00 level.
EUR/JPY Technical Analysis
The Euro formed a decent support base near the 125.00 level against the Japanese Yen. The EUR/JPY pair gained traction above 126.00 and 127.00 resistance levels to move into a positive zone.
The upside move was strong as the pair settled above the 127.00 pivot level and the 50 simple moving average. The pair climbed above the 50% Fib retracement level of the last decline from the 129.45 high to 124.90 low.
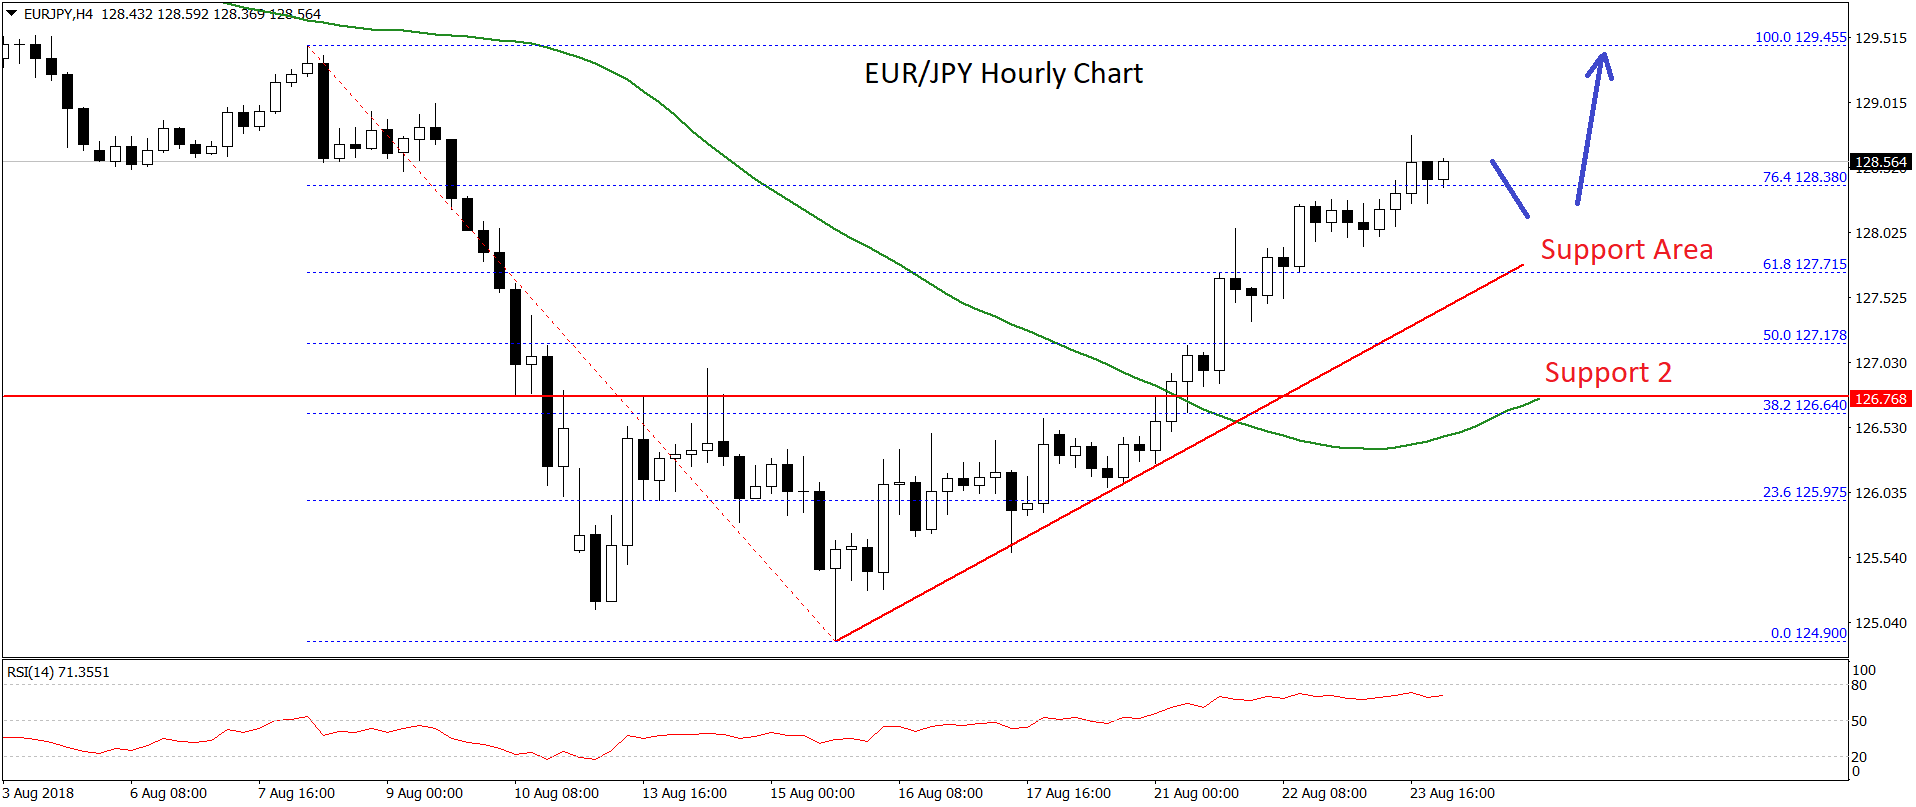
It opened the doors for more gains and the pair broke the 128.00 resistance. There was also a break above the 76.4% Fib retracement level of the last decline from the 129.45 high to 124.90 low. It indicates that the pair may perhaps rise towards the 129.45 swing high.
If there is a downside correction, the pair is likely to find the support near the 127.50/70 zone. There is also a crucial bullish trend line in place with support at 127.60 on the 4-hours chart.
Below the trend line support, the 127.00 level is a decent support area since it coincides with the 50 SMA. Overall, the market sentiment is positive and EUR/JPY is likely to accelerate gains above the 128.50 level in the near term.
GBP/JPY Technical Analysis
The British Pound recently declined below the 140.00 level against the Japanese Yen. The GBP/JPY pair traded as low as 139.91 and later it started an upward move.
The pair climbed higher and broke the 141.00 resistance area along with a bearish trend line on the 4-hours chart. Later, the pair gained momentum and broke the 141.50 resistance and the 100 simple moving average.
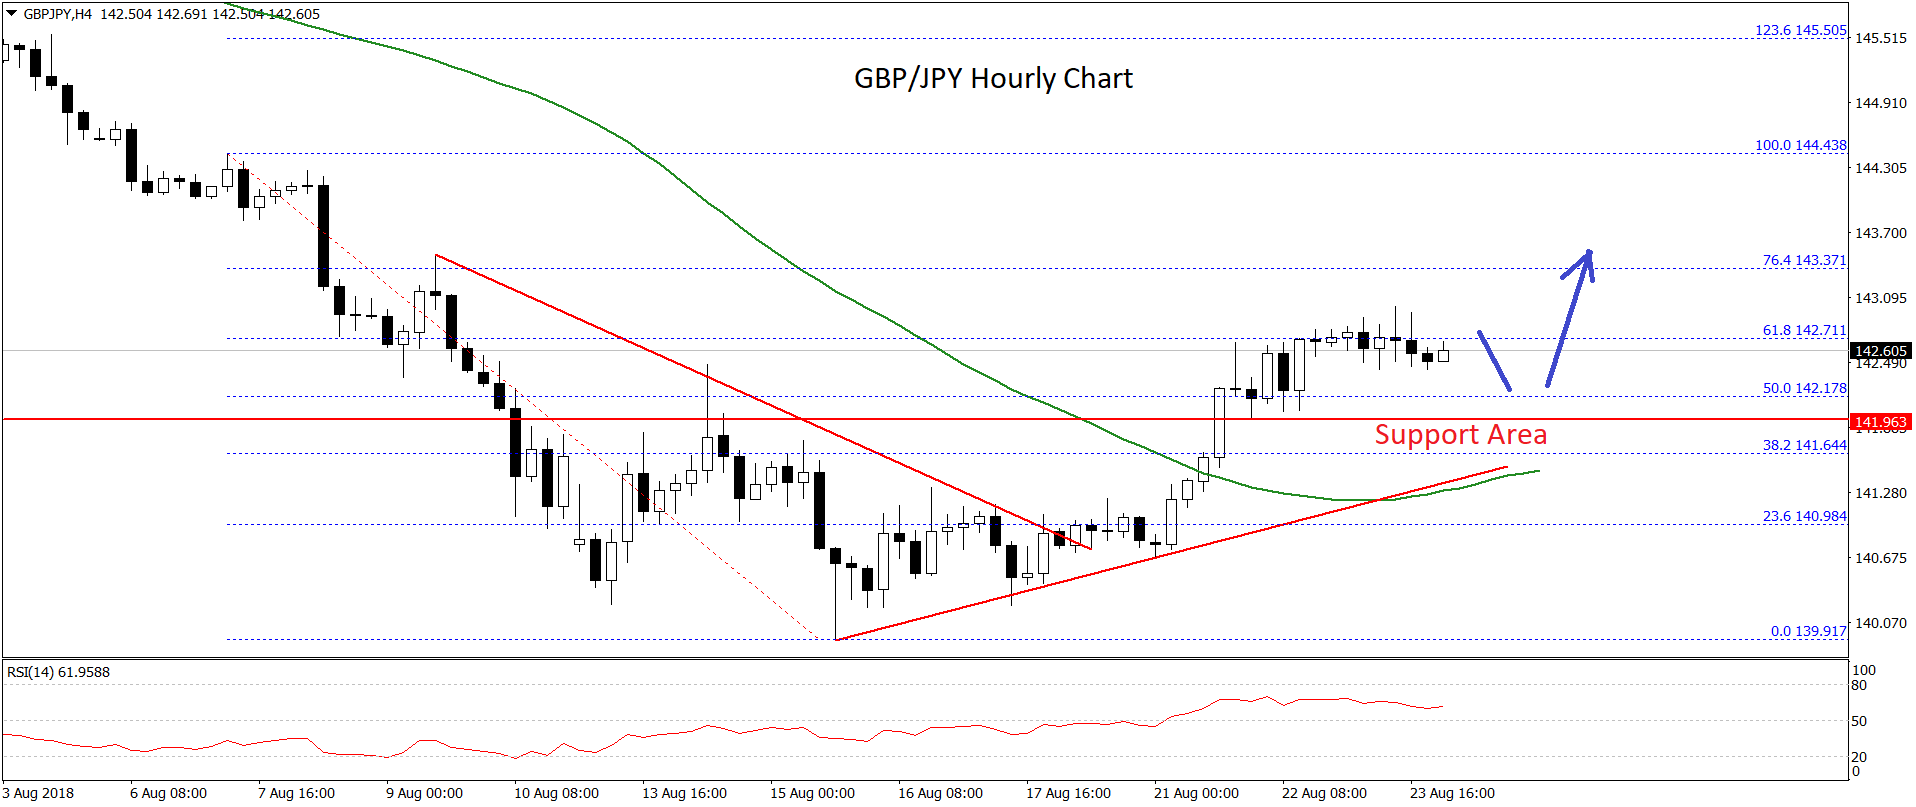
Moreover, there was a break above the 50% Fib retracement level of the last decline from the 144.43 high to 139.91 low. On the upside, the next resistance for buyers are near the 143.35 level.
Moreover, the 76.4% Fib retracement level of the last decline from the 144.43 high to 139.91 low is also around 143.50 zone to prevent further upsides. Should there be a break above this, the pair is likely to visit the last swing high at 144.43.
On the other hand, if there is a downside correction, the broken support at 142.00 may well act as a support. There is also a key bullish trend line with support at 141.50 is the next major buy zone.
Overall, both EUR/JPY and GBP/JPY are trading in a positive zone and if buyers remain in control, there could be more gains above 129.00 and 143.00 levels respectively in the near term.
Trade over 50 forex markets 24 hours a day with FXOpen. Take advantage of low commissions, deep liquidity, and spreads from 0.0 pips. Open your FXOpen account now or learn more about trading forex with FXOpen.
This article represents the opinion of the Companies operating under the FXOpen brand only. It is not to be construed as an offer, solicitation, or recommendation with respect to products and services provided by the Companies operating under the FXOpen brand, nor is it to be considered financial advice.
Stay ahead of the market!
Subscribe now to our mailing list and receive the latest market news and insights delivered directly to your inbox.

Latest from Forex Analysis
Latest articles

Weekly Market Wrap With Gary Thomson: Nasdaq, EUR/USD, USD/CHF, Brent Crude Oil, Googl Shares
Get the latest scoop on the week's hottest headlines, all in one convenient video. Join Gary Thomson, the COO of FXOpen UK, as he breaks down the most significant news reports and shares his expert insights.
- Nasdaq Composite: Worst Session

Analysis of AUD/USD: Exchange Rate Falls to Early May Low
As indicated by the 4-hour AUD/USD chart today:
→ the rate fell below 0.652, a level last seen on May 2;
→ the RSI indicator dropped below 15, a level last seen during the panic over the spread of COVID-19

Analysis of AMZN Stock: Price at 1.5-Month Low
As shown in the AMZN chart, the stock price dropped below:
→ the psychological level of $180;
→ the mid-June interim low.
The last time AMZN traded below $180 was in early June.
Thus, AMZN has faced sell-offs, similar to other tech