


EUR/JPY and GBP/JPY Monthly Outlook
FXOpen

The Euro and British Pound declined heavily in the past few months against the Japanese Yen. Both EUR/JPY and GBP/JPY are correcting higher, but upsides are likely to remain capped.
Important Takeaways for EUR/JPY and GBP/JPY
- The Euro settled below the main 120.00 support area against the Japanese Yen.
- There is a key bearish trend line forming with resistance near 118.60 on the daily chart of EUR/JPY.
- GBP/JPY is trading well below the key 132.00 and 131.20 support levels.
- There is a major bearish trend line forming with resistance near 131.00 on the daily chart.
EUR/JPY Technical Analysis
In May 2019, the Euro started a major decline from well above the 125.00 support against the Japanese Yen. The EUR/JPY pair broke many key supports near 124.00 and 122.00 to move into a bearish zone.
Moreover, there was a close below the main 120.00 support and the 50-day simple moving average. It opened the doors for more downsides below the 118.00 support level. Finally, the pair traded below 116.50 and a new multi-month low was formed at 115.85 on FXOpen.
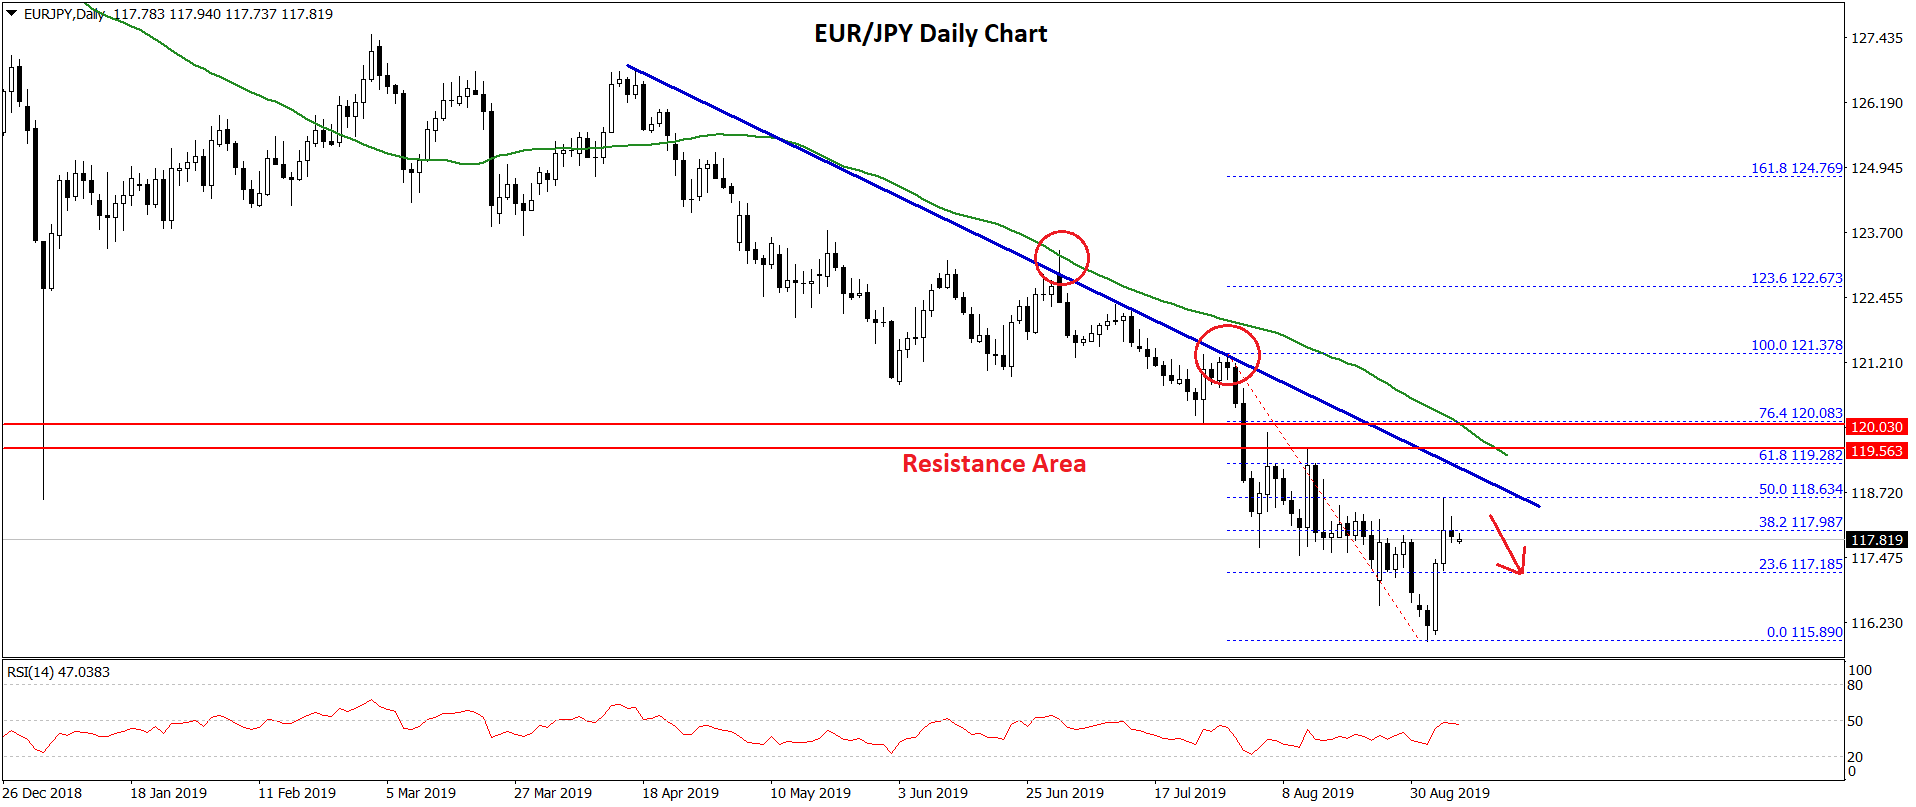
Recently, the pair started consolidating losses above 115.80 and 116.00. An immediate resistance on the upside is near the 118.00 level. It coincides with the 38.2% Fib retracement level of the last key decline from the 121.37 high to 115.85 low.
Moreover, there is a key bearish trend line forming with resistance near 118.60 on the daily chart of EUR/JPY. The trend line coincides with the 50% Fib retracement level of the last key decline from the 121.37 high to 115.85 low.
Above the trend line, the main resistance is near the 120.00 level. Therefore, if there is an upside correction, EUR/JPY is likely to face a strong resistance near the 118.00, 118.50 and 120.00 levels.
On the downside, if there is a break below the 115.50 support, the pair could continue to decline towards the 114.00 and 112.00 support levels.
GBP/JPY Technical Analysis
The British Pound also followed a similar path and started a nasty decline from the 148.00 resistance area against the Japanese Yen. The GBP/JPY pair broke the key 142.00 and 140.00 support levels to enter a bearish zone.
The decline was such that the pair even failed to stay above the 135.00 support zone and the 50-day simple moving average. Finally, the pair traded below 130.00 and a new multi-month low was formed at 126.47.
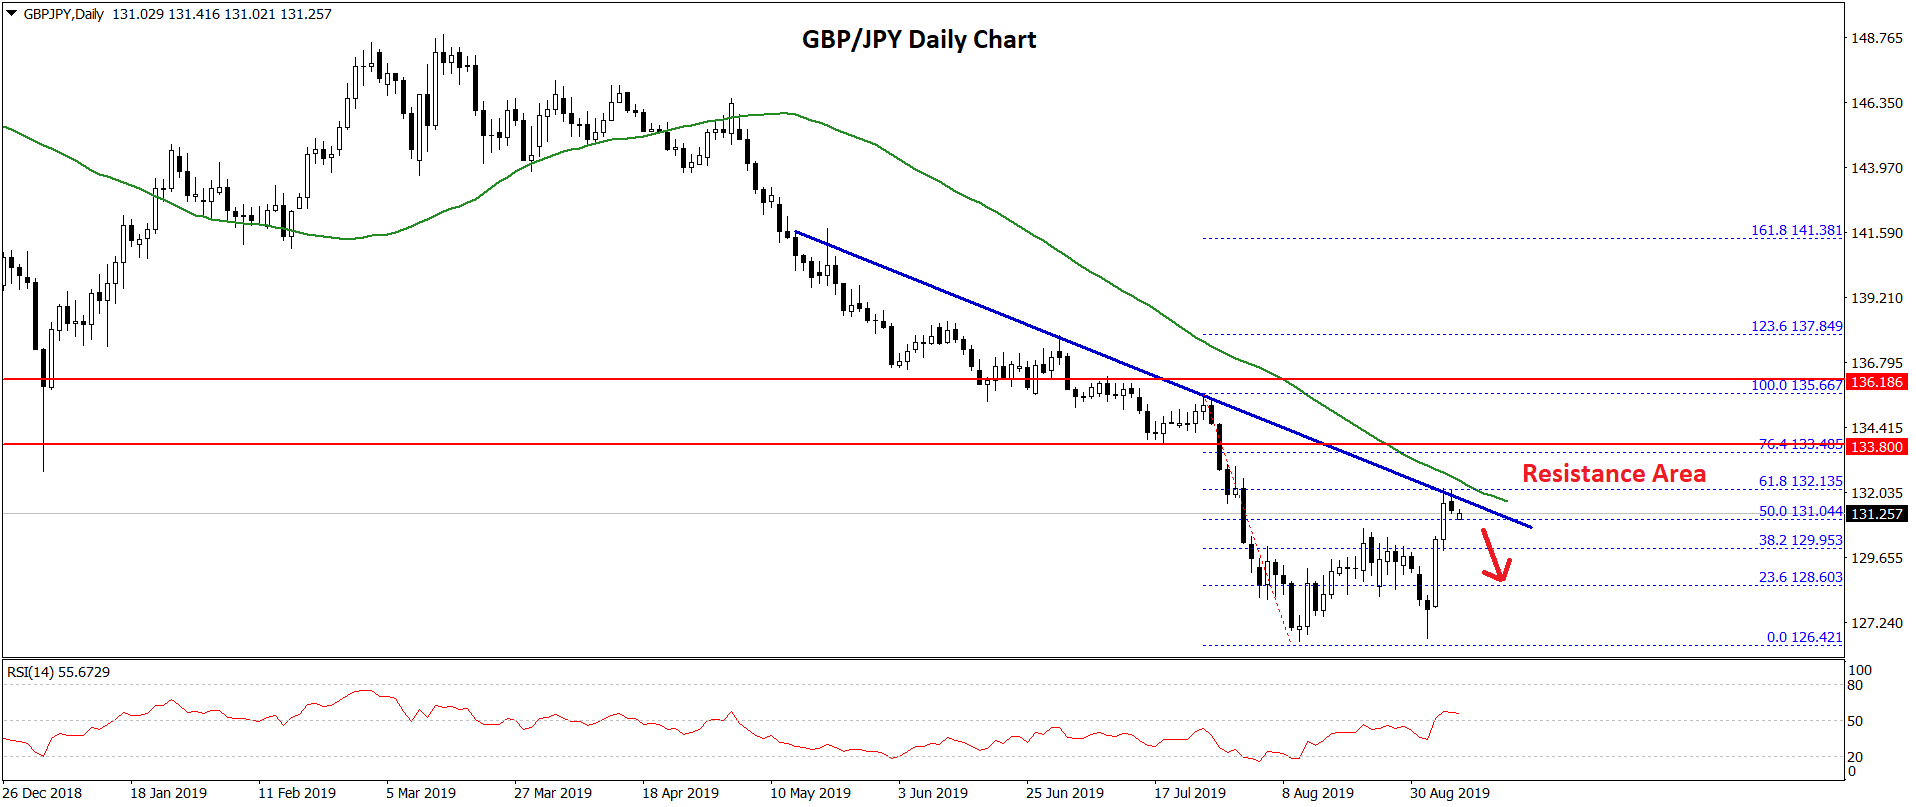
Recently, the pair started consolidating losses above the 127.00 level. However, there are many hurdles on the upside near the 131.00 level. Moreover, the 50% Fib retracement level of the last key decline from the 135.66 high to 126.47 low is also near the 131.00 level.
Besides, there is a major bearish trend line forming with resistance near 131.00 on the daily chart. Above the trend line, the 50-day simple moving average is positioned near the 132.10 level.
The 61.8% Fib retracement level of the last key decline from the 135.66 high to 126.47 low is also near the 132.15 level. Therefore, the pair is likely to struggle near the 131.00 and 132.00 levels.
On the downside, if there is a break below the 127.00 support area, the GBP/JPY pair could continue to decline towards the 125.00 and 124.40 support levels.
Trade over 50 forex markets 24 hours a day with FXOpen. Take advantage of low commissions, deep liquidity, and spreads from 0.0 pips (additional fees may apply). Open your FXOpen account now or learn more about trading forex with FXOpen.
This article represents the opinion of the Companies operating under the FXOpen brand only. It is not to be construed as an offer, solicitation, or recommendation with respect to products and services provided by the Companies operating under the FXOpen brand, nor is it to be considered financial advice.
Stay ahead of the market!
Subscribe now to our mailing list and receive the latest market news and insights delivered directly to your inbox.


Latest articles

EUR/USD and GBP/USD consolidate ahead of the Fed decision
European currencies are showing subdued dynamics, entering a consolidation phase following their previous advance. Earlier, EUR/USD and GBP/USD broke out of their ranges and strengthened; however, the subsequent correction has led both pairs to retest the previously breached

Meta: V-Shaped Recovery Meets Heavy Volume Resistance
The movement in Meta Platforms shares is being driven by two competing narratives. On one hand, advertising revenue is benefiting from AI-based tools: the Advantage+ platform continues to support strong advertiser demand, and the analyst consensus for Q1 2026 revenue

Commodity Currencies Test Key Levels Ahead of Major Macro Data
Commodity-linked currencies are trading near key levels, showing restrained price action as market participants adopt a wait-and-see approach. The fundamental backdrop is shaped by expectations surrounding the release of Australia’s inflation data and the Bank of Canada’s interest