


EUR/JPY and GBP/JPY Primed For More Gains
FXOpen

The Euro and British Pound are gaining bullish momentum against the Japanese Yen. Both EUR/JPY and GBP/JPY are likely to continue higher above 120.50 and 142.00 respectively.
Important Takeaways for EUR/JPY and GBP/JPY
- The Euro gained pace after it broke the 120.00 resistance area against the Japanese Yen.
- There is a key bullish trend line forming with support near 120.40 on the hourly chart of EUR/JPY.
- GBP/JPY surged above the 140.50 and 141.00 resistance levels to move into a positive zone.
- There is a major bullish trend line forming with support near 140.80 on the hourly chart.
EUR/JPY Technical Analysis
After a bearish reaction, the Euro found support near the 119.70 level against the Japanese Yen. The EUR/JPY pair started a decent upward move and broke the main 120.00 resistance area.
The upward move was strong as the pair surged above the 120.20 and 120.40 resistance levels. Moreover, there was a break above a connecting bearish trend line with resistance near 120.20 on the hourly chart.
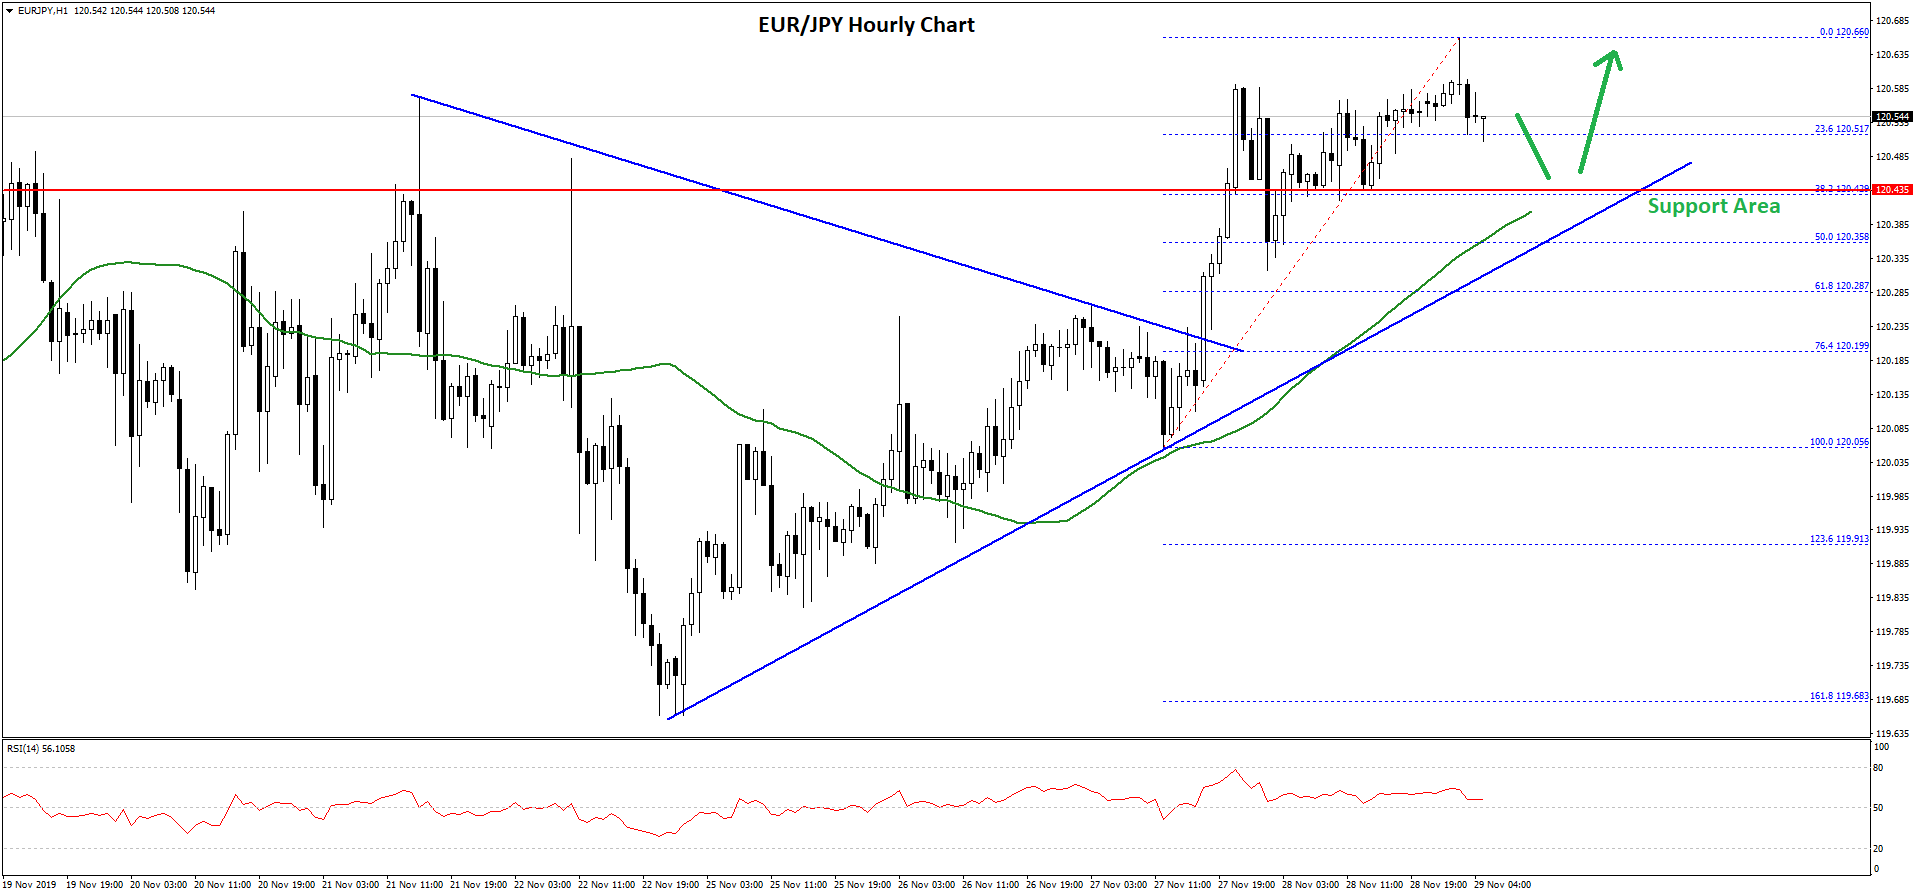
Finally, there was a close above the 120.40 level and the 50 hourly simple moving average. A high was formed near 120.66 on FXOpen and the pair is currently correcting lower.
It is testing the 23.6% Fib retracement level of the recent leg from the 120.05 low to 120.66 high. On the downside, there is a strong support forming near the 120.40 level.
Moreover, there is a key bullish trend line forming with support near 120.40 on the hourly chart of EUR/JPY. The 50 hourly simple moving average is also near the 120.40 support area.
Below the trend line, the pair could test the 50% Fib retracement level of the recent leg from the 120.05 low to 120.66 high. Any further downsides might call for a test of the 120.00 support area.
On the upside, an initial resistance is near the 120.65 level. A successful break above the 120.65 resistance might open the doors for more gains towards the 121.00 and 121.50 levels.
GBP/JPY Technical Analysis
Earlier this week, the British Pound formed a strong support near the 140.00 level against the Japanese Yen. As a result, the GBP/JPY pair started a strong upward move above the 140.50 and 141.00 resistance levels.
Moreover, the price climbed above the 141.50 level and the 50 hourly simple moving average. A high was formed near the 141.84 level and the pair is currently correcting lower.
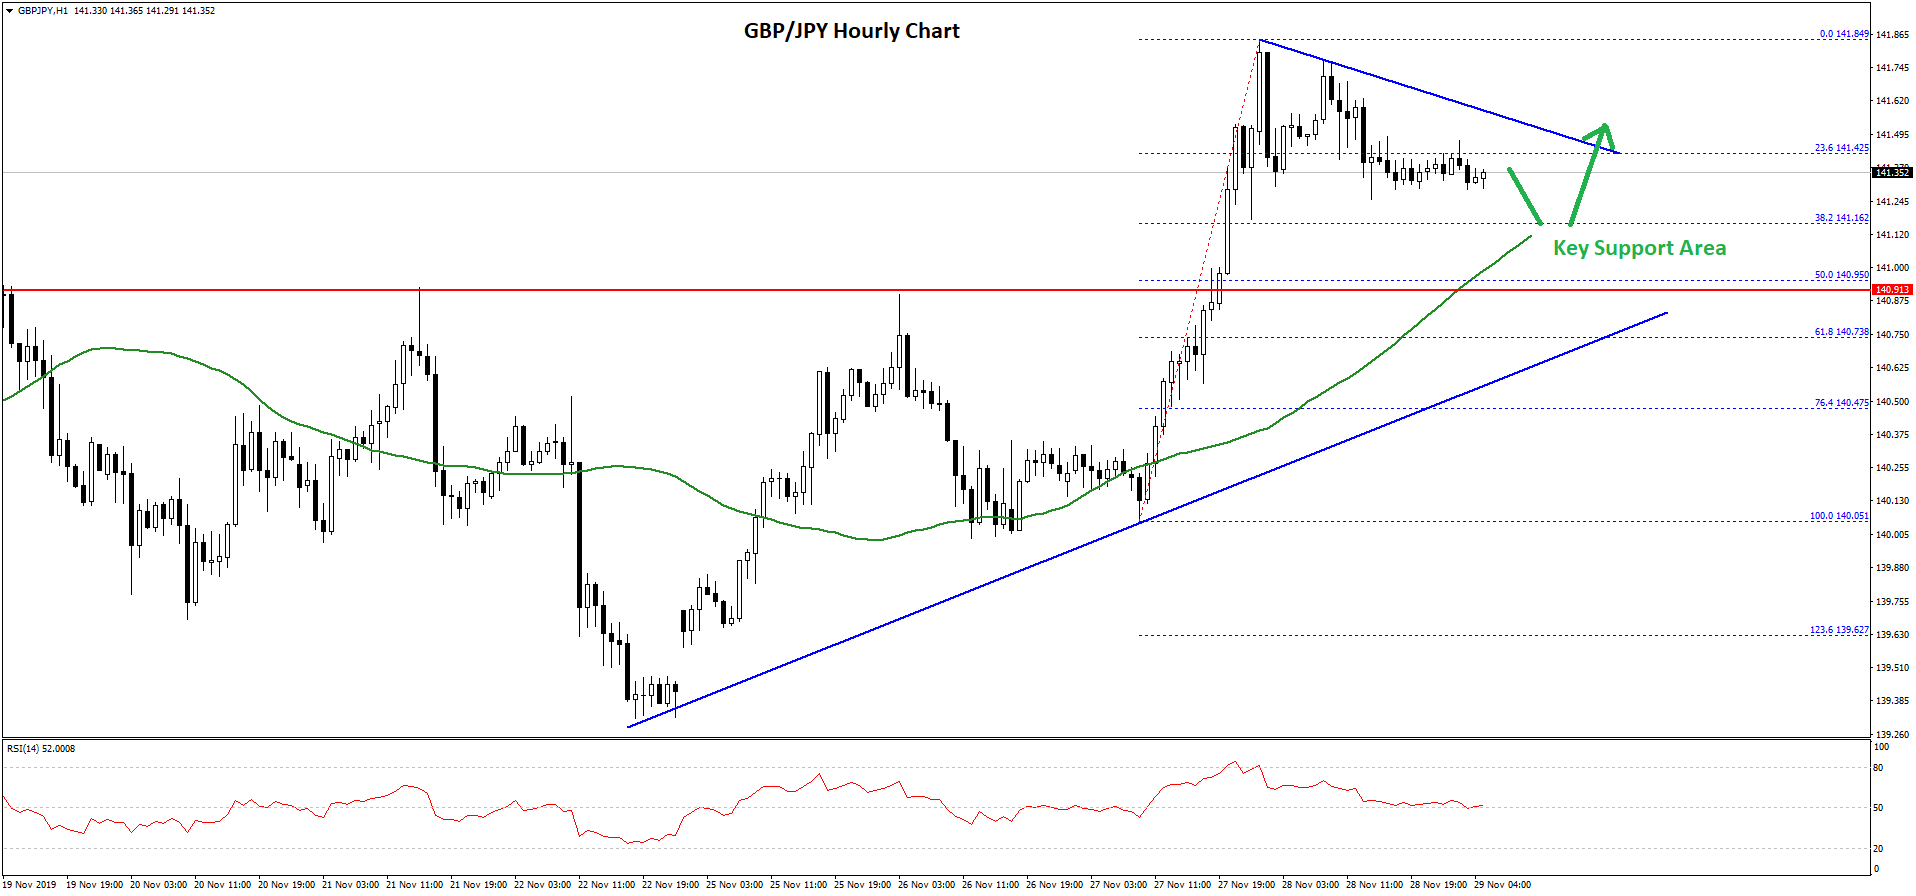
It broke the 23.6% Fib retracement level of the recent wave from the 140.05 low to 141.84 high. On the downside, an initial support is near the 141.10 and 141.00 levels.
The 50 hourly simple moving average is also near the 141.00 level. Besides, there is a major bullish trend line forming with support near 140.80 on the hourly chart.
Finally, the 50% Fib retracement level of the recent wave from the 140.05 low to 141.84 high is also near the 141.00 area. Therefore, the pair remains well supported as long as there is no close below the 141.00 and 140.80 support levels.
On the upside, an initial hurdle is near the 142.00 area and a connecting bearish trend line on the same chart. If there is an upside break above the 142.00 resistance area, the GBP/JPY pair could continue to climb towards the 142.50 and 143.20 levels.
Trade over 50 forex markets 24 hours a day with FXOpen. Take advantage of low commissions, deep liquidity, and spreads from 0.0 pips (additional fees may apply). Open your FXOpen account now or learn more about trading forex with FXOpen.
This article represents the opinion of the Companies operating under the FXOpen brand only. It is not to be construed as an offer, solicitation, or recommendation with respect to products and services provided by the Companies operating under the FXOpen brand, nor is it to be considered financial advice.
Stay ahead of the market!
Subscribe now to our mailing list and receive the latest market news and insights delivered directly to your inbox.


Latest articles

EUR/USD Eyes Gains As USD/CHF Weakness Deepens Again
EUR/USD started a fresh increase above 1.1700 and 1.1720. USD/CHF declined further and is now struggling below 0.7835.
Important Takeaways for EUR/USD and USD/CHF Analysis Today
· The Euro started a decent increase from

Apple: Earnings Day Above the Activity Zone
On 30 April, after the market close, Apple Inc. will release its financial results for the second quarter of fiscal 2026. The consensus forecast, based on estimates from 31 analysts, points to revenue of around $109.7 billion, with expected

USD/JPY and USD/CHF Near Key Levels: The Dollar Supported by the Fed
The US dollar continues to trend upwards following the Federal Reserve meeting, drawing support from the regulator’s moderately hawkish stance and comments by Jerome Powell. Markets interpret the Fed’s rhetoric as a signal that restrictive policy is likely